
Applicable for ENA v17.0 P09 and ENA v18.0 P01 upwards. If you are using an earlier version of Entuity, please see this article.
The Cisco IPSec VPN dashboard gives you a summary of information about VPN devices. This dashboard is only applicable to Cisco IPSec VPN devices. It is not applicable to any other VPN devices, nor any other data sources.
The VPNs dashboard is a system dashboard. This means that you cannot edit the settings of the dashboard. However, you can create a copy of a system dashboard and edit that copy as you want.
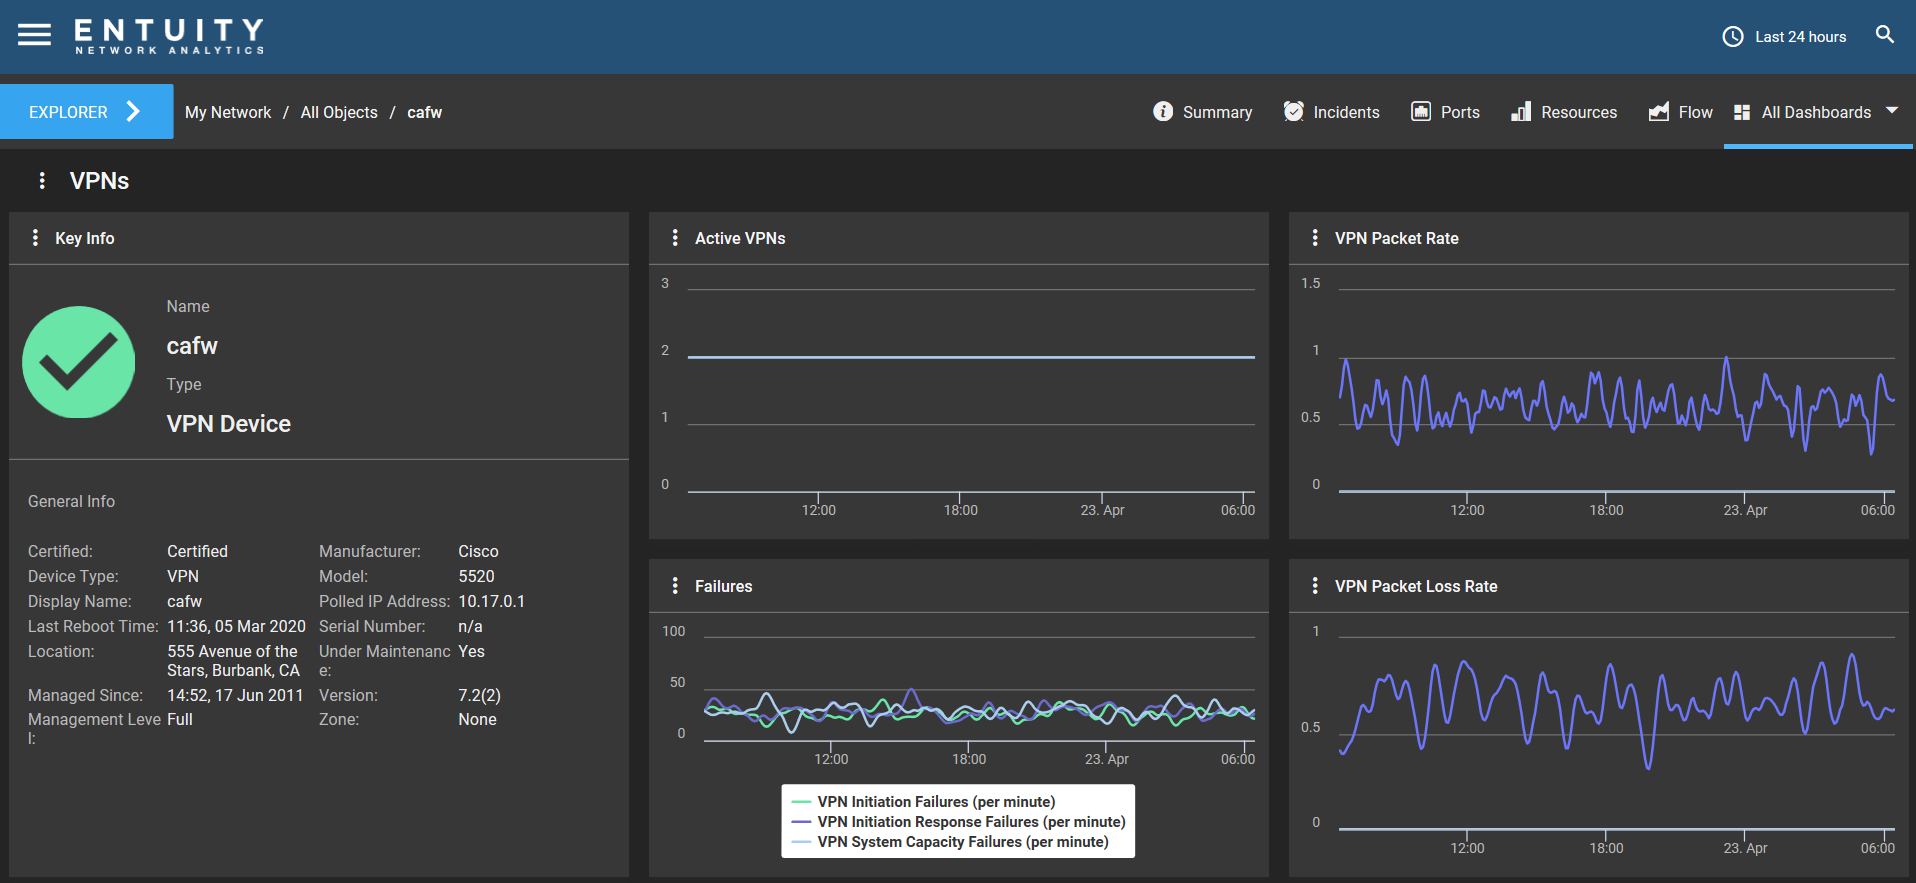
The Cisco IPSec VPN dashboard has five dashlets:
- Key Info - this is a Key Info dashlet. This dashlet displays information about and the status of the selected VPN device.
- Active VPNs - this is a Chart dashlet. This dashlet displays the number of active VPNs on the device.
- VPN Packet Rate - this is a Chart dashlet. This dashlet displays the inbound and outbound VPN packet rate over a specified period of time.
- Failures - this is a Chart dashlet. This dashlet displays the following metrics, measured per minute:
- VPN initiation failures.
- VPN initiation response failures.
- VPN system capacity failures.
- VPN Packet Loss Rate - this is a Chart dashlet. This dashlet displays the inbound and outbound VPN packet loss rate over a specified period of time.
For the VPN device, these metrics are provided by the CISCO-IPSEC-FLOW-MONITOR-MIB (-.1.3.6.1.4.1.9.9.171), specifically the following OIDs:
- CiscoVpnActiveIpsecVpns
.1.3.6.1.4.1.9.9.171.1.2.1.1.0 - vpnInPktsDrop
.1.3.6.1.4.1.9.9.171.1.3.1.10.0 - vpnOutPkts
.1.3.6.1.4.1.9.9.171.1.3.1.22.0 - vpnOutPktsDrop
.1.3.6.1.4.1.9.9.171.1.3.1.23.0 - vpnInitiationFailure
.1.3.6.1.4.1.9.9.171.1.2.1.20.0 - vpnInitiationResponseFailure
.1.3.6.1.4.1.9.9.171.1.2.1.21.0 - vpnSysCapacityFailure
.1.3.6.1.4.1.9.9.171.1.2.1.22.0 - vpnInPkts
.1.3.6.1.4.1.9.9.171.1.3.1.9.0
Comments
0 comments
Please sign in to leave a comment.