
To generate an inventory flex report
To generate an inventory TopN report
To generate an inventory graph report
- Click the Main Menu and then Reports. This willl open the Reports page.
- Click Flex Reports, and then click Flex Report Builder.
- You will have the option to generate one of 3 report types:
- Inventory Report - configure a report that displays your inventory of network objects, their dependencies in parent-child and peer-to-peer relationships, and their physical connectivity.
- TopN Report - configure a report that displays all or a restricted set (topN) of the returned data items.
- Graph Report - configure a report that contains one or more graphs, and each graph may plot one or more data types (series).
The tabular format of flex report is a nested table, whereby the top table references further tables down below in a linked manner. This means that a hyperlink in a table will take you down the report to where the section where the subject of the hyperlink is/are listed.
To generate an inventory flex report:
- On the Generate Inventory Report page, enter the name given to the report in the Report Name field.
- Enter the title of the report that will appear in the generated report in the Report Title field.
- Enter the company name that will appear in the generated report in the Company Name field.
- In the Company Logo URL field, enter the location and file name of hte logo you want to use on the generated report. By default, the folder the same as the folder containing the stylesheets: install_dir/lib/httpd/EOS/reporting/stylesheets. The image should be a gif format. Entuity proportionally scales the image to fit the height of the logo space on the report.
- In the View field, select the View in which are located the managed objects you want to report on. All flex reports are constrained by the selected View - only objects within a the selected View can be included to a report.
- Select the Output Format from the dropdown field (one of csv, html, pdf or xml).
- Choose the component type on which you would like to report in the Components field.
- In order to update the page so that will now display the list of selectable attributes belonging to the component type choice you have just made, click the Next button. The page will then update to display these options. Note, an additional Next button will appear, which has the same functionality as the original one that you clicked.
- Once you have selected your desired component type and clicked Next, a filter option will also become available next to the Components table.
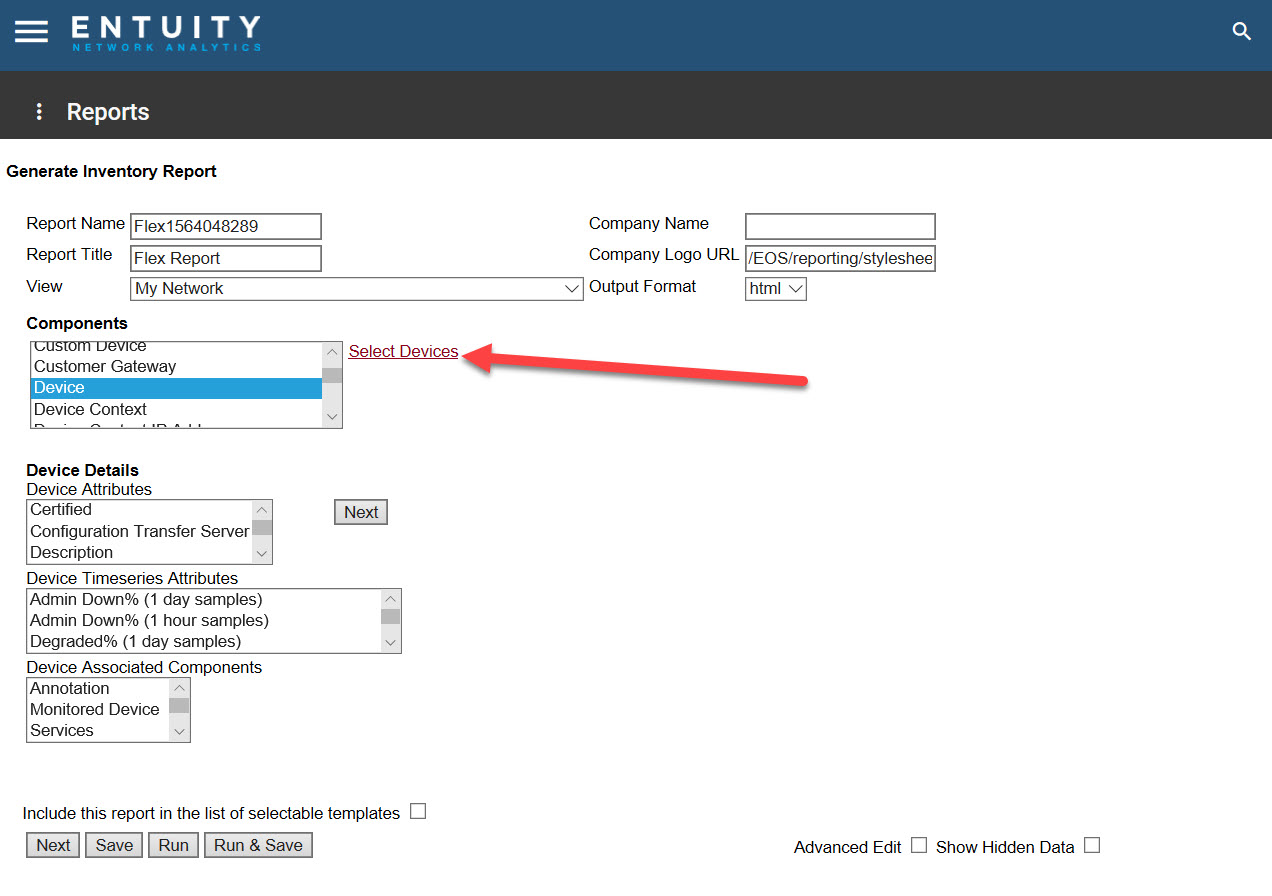
For example, if you select 'Device' in the Components table, the filter link Select Devices will appear. Click this link to open the Find Filter window, where you can specify your filters. Click Apply Filter to see the results of the filter in the filter window, and if you are happy with these, click Use These Filters at the top of the window. The window will close and the parameters of the report will be updated.
- Once you have selected your desired component type and clicked Next, a filter option will also become available next to the Components table.
- Select the attributes you would like to include to the report. Use ctrl/shift click to select multiple attributes.
- If you select a timeseries attribute, clicking Next will update the page to display further summarization options for the selected timeseries attribute, on account of there being multiple samples available for timeseries attributes, e.g. Last Value, First Valid, Mean, 95th percentile etc.

- If you select a timeseries attribute, clicking Next will update the page to display further summarization options for the selected timeseries attribute, on account of there being multiple samples available for timeseries attributes, e.g. Last Value, First Valid, Mean, 95th percentile etc.
- If you would like the parameters of this report to become a template for future reports, tick the Include this report in the list of selectable templates box.
- If you would like to specify a reporting period time frame, tick the Advanced Edit box and click Next to update the page. You will then have the option to specify the following:
- Prime Time - only data collected during this time is reported.
- Reporting Period - either Last Hour, Last Day, Last Week or Last Month.
- Device Sort Criteria - specify the manner in which you want the report to be sorted.
- Device Timeseries Data - specify the timeseries that you want to include in a graphical form.
- Click Save, Run, or Run & Save.
To generate an inventory TopN report:
- On the Generate TopN Report page, enter the name given to the report in the Report Name field.
- Enter the title of the report that will appear in the generated report in the Report Title field.
- Enter the company name that will appear in the generated report in the Company Name field.
- In the Company Logo URL field, enter the location and file name of hte logo you want to use on the generated report. By default, the folder the same as the folder containing the stylesheets: install_dir/lib/httpd/EOS/reporting/stylesheets. The image should be a gif format. Entuity proportionally scales the image to fit the height of the logo space on the report.
- In the View field, select the View in which are located the managed objects you want to report on. All flex reports are constrained by the selected View - only objects within a the selected View can be included to a report.
- Select the Output Format from the dropdown field (one of csv, html, pdf or xml).
- If you would like to specify a reporting period time frame, complete the following:
- Prime Time - only data collected during this time is reported.
- Reporting Period - either Last Hour, Last Day, Last Week or Last Month.
- Choose the component type on which you would like to report in the Components field.
- In order to update the page so that will now display the list of selectable attributes belonging to the component type choice you have just made, click the Next button. The page will then update to display these options. Note, an additional Next button will appear, which has the same functionality as the original one that you clicked.
- Once you have selected your desired component type and clicked Next, a filter option will also become available next to the Components table.
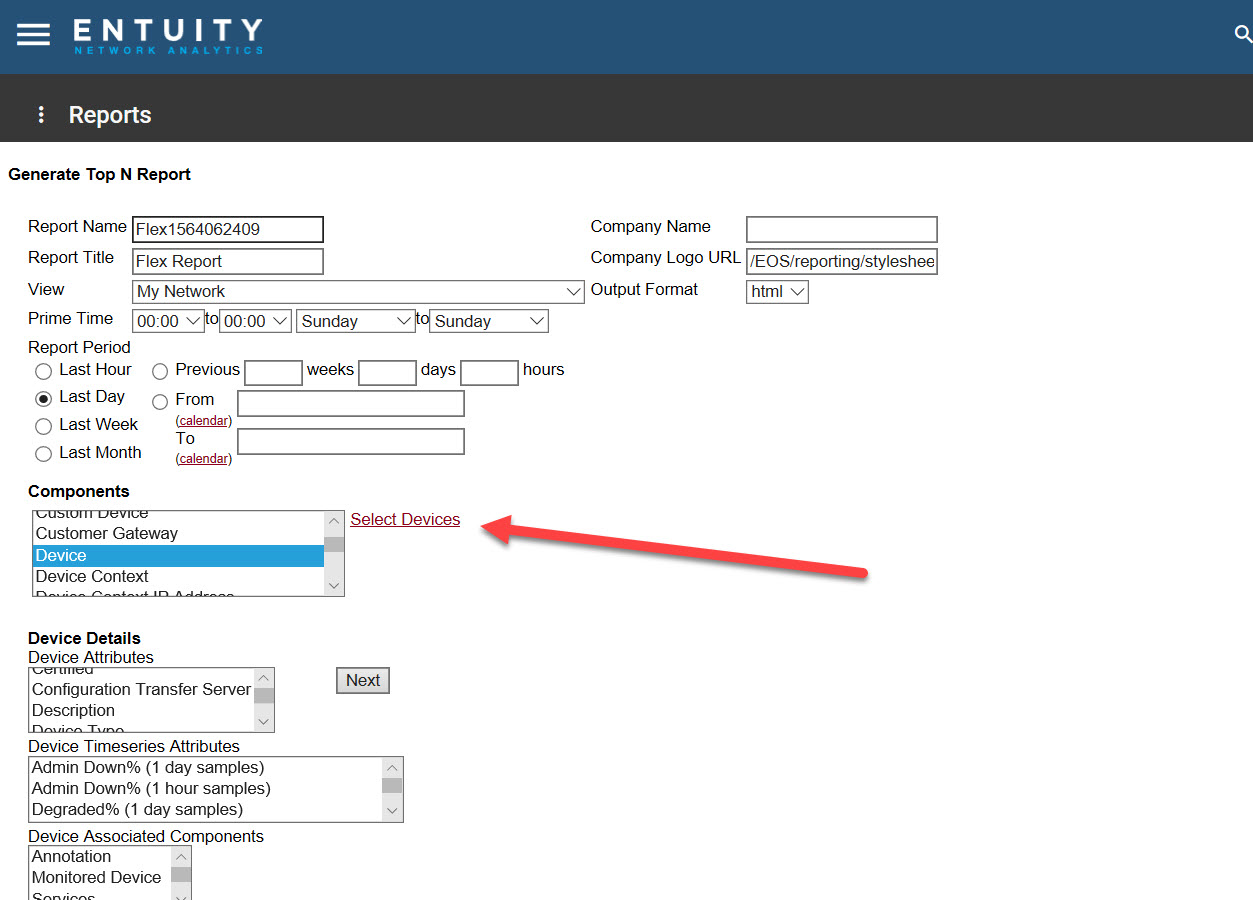
For example, if you select 'Device' in the Components table, the filter link Select Devices will appear. Click this link to open the Find Filter window, where you can specify your filters. Click Apply Filter to see the results of the filter in the filter window, and if you are happy with these, click Use These Filters at the top of the window. The window will close and the parameters of the report will be updated.
- Once you have selected your desired component type and clicked Next, a filter option will also become available next to the Components table.
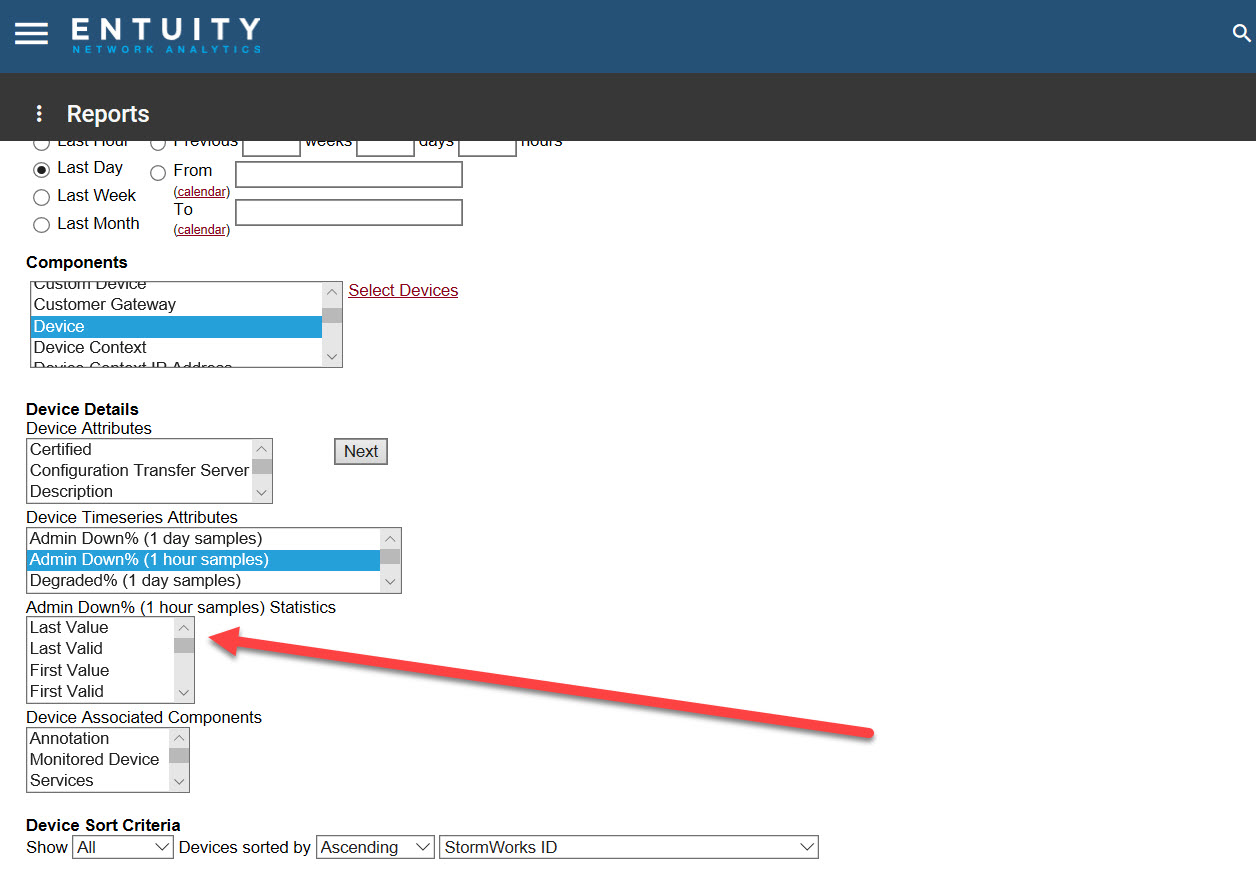
- Select the attributes you would like to include to the report. Use ctrl/shift click to select multiple attributes.
- If you select a timeseries attribute, clicking Next will update the page to display further summarization options for the selected timeseries attribute, on account of there being multiple samples available for timeseries attributes, e.g. Last Value, First Valid, Mean, 95th percentile etc.
- If you select a timeseries attribute, clicking Next will update the page to display further summarization options for the selected timeseries attribute, on account of there being multiple samples available for timeseries attributes, e.g. Last Value, First Valid, Mean, 95th percentile etc.
- If you would like the parameters of this report to become a template for future reports, tick the Include this report in the list of selectable templates box.
- Specify the manner in which you want the report to be sorted in the Device Sort Criteria fields.
- Device TImeseries Data - specify the timeseries that you want to include in a graphical form
- If you would like to specify a reporting period time frame, tick the Advanced Edit box and click Next to update the page. You will then have the option to specify the following:
- Device TImeseries Data - specify the timeseries that you want to include in a graphical form.
- Click Save, Run, or Run & Save.
To generate an inventory graph report:
- On the Generate Graph Report page, you will need to complete the graph filter fields, as described below.
- Specify the View in which is the data that you want to report on in the view field.
- Specify the component type that you want to report on in the type field.
- Tick the use advanced filter settings to access further sample options.
- Click Apply Filter to create the filter. You can create as many filters as you like.
- You can then choose to either create a report from a selected filter or filters by clicking either Create Report Using This Filter or Create Report Using This Selection.
Comments
0 comments
Please sign in to leave a comment.