
To run a Port Bandwidth Capacity Planning Trend report
The Port Bandwidth Capacity Planning Trend report provides a management-level summary of port utilization for the selected View. The report provides details on port utilization %, mean, percentile, trend and mean traffic rate over the reporting period.

Port Bandwidth Capacity Planning Trend report details:
The report contains a table that highlights devices with port utilization in warning and critical states. You can configure the definition of warning and critical states. A critical state indicates a potential capacity problem.
| Name | Description |
|---|---|
| Device Name | resolved name or the IP address of the device. |
| Port Description | description of the port. This is also a hyperlink to the Port Utilization Details report. |
| In/out Util% mean | mean inbound and outbound port utilization over the reporting period for the port. |
| In/out (Mbps) Rate mean | rate of inbound and outbound traffic for the port, over the reporting period. |
| n/out Util% 95th percentile | indicates the 95th percentile of inbound and outbound utilization values over the reporting period, as a % of inbound and outbound resource respectively. |
| In/out Util% 6 month predicted | predicts inbound and outbound port utilization in 6 months' time, as a % of inbound and outbound capacity respectively. Click on a value to run the Port Utilization Trend report within the context of the selected port. |
To run a Port Bandwidth Capacity Planning Trend report:
- In the Main Menu, click Reports.
- This will open the Reports page. Click Planning Reports.
- This will open the Planning Reports page. Click Port Bandwidth Capacity Planning Trend.
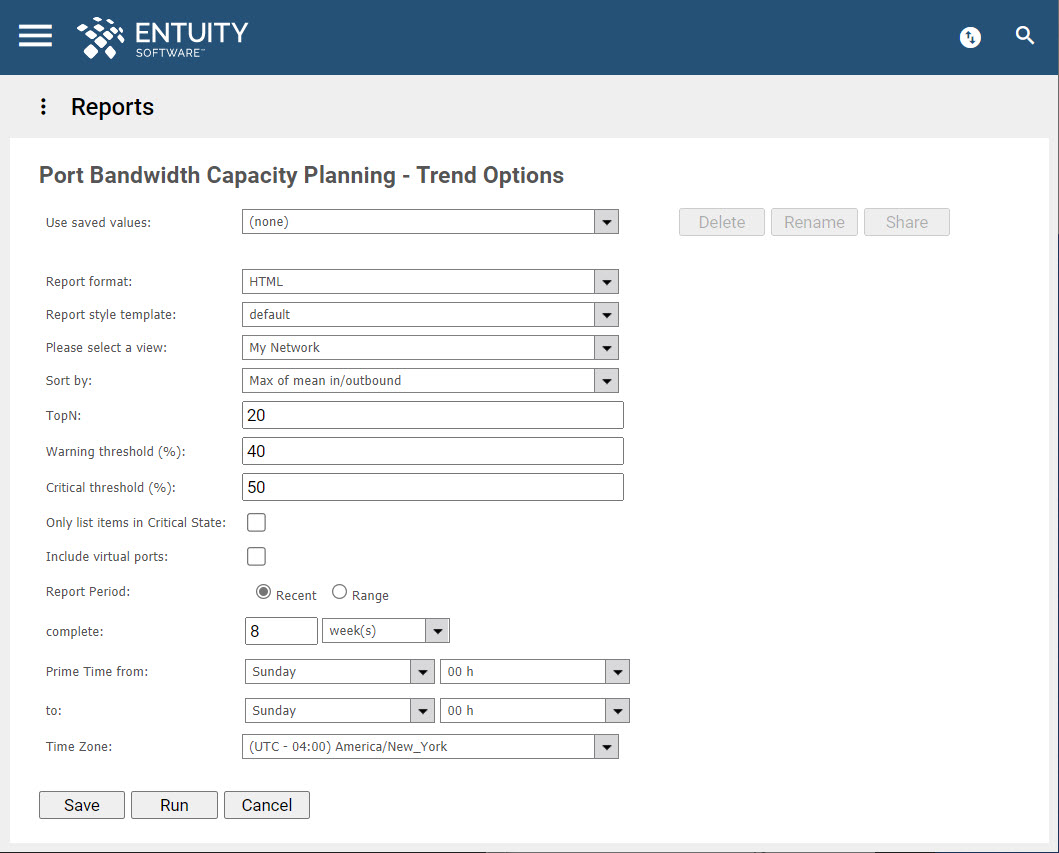
- This will open the Port Bandwidth Capacity Planning Trend Options page.
- If you want to reuse previously saved report values, select it in the Use saved values dropdown field.
- Specify the format of the report in the Report format field.
- Specify the View against which the report is to be run in the Please select a View dropdown field. From ENA v18.0 P06 upwards, you can drag Views into this field from the Drop Box.
- Specify the manner in which you want to sort the report in the Sort by field. Choose from one of the following:
- Mean inbound.
- Mean outbound.
- 95th percentile inbound.
- 95th percentile outbound.
- 6 month projected inbound.
- 6 month projected outbound.
- Max of mean in/outbound.
- Max of 95th percentile in/outbound.
- Max of 6 month projected.
- Specify the number of devices reporting the highest values decided in the Sort by field to which the report is limited in the TopN field. By default, this is 20, e.g. the 20 devices with the highest mean inbound values would be included to the report.
- Specify the % threshold for mean average hourly port bandwidth utilization, above which utilization is considered to be in a warning state (and when it is equal to or below the critical threshold) in the Warning Threshold (%) field. The default value is 50.
- Specify the % threshold for mean average hourly port bandwidth utilization, above which utilization is considered to be in a critical state in the Critical Threshold (%) field.
- Tick the Only list devices in a Critical State box if you want to only include to the report devices in a critical state. By default, it is not ticked.
- ENA v17.0 P08 upwards - tick the Include virtual ports box if you want to include virtual ports to the report. By default, this is not ticked, meaning that only physical ports would be included to the report.
- Specify if you want the Report Period to be a Recent period or across a Range.
- Specify the time within the reporting period for which the report is applicable in the Prime Time fields, e.g. between 09:00 and 17:00 each day.
- ENA v17.0 P08 upwards: Specify the time zone to which you want the reporting period to apply. By default, this is set to None, which means that the time zone of the host/consolidation server is used.
- Click Save to save your report values, Run to run immediately, or click Cancel.
Comments
0 comments
Please sign in to leave a comment.