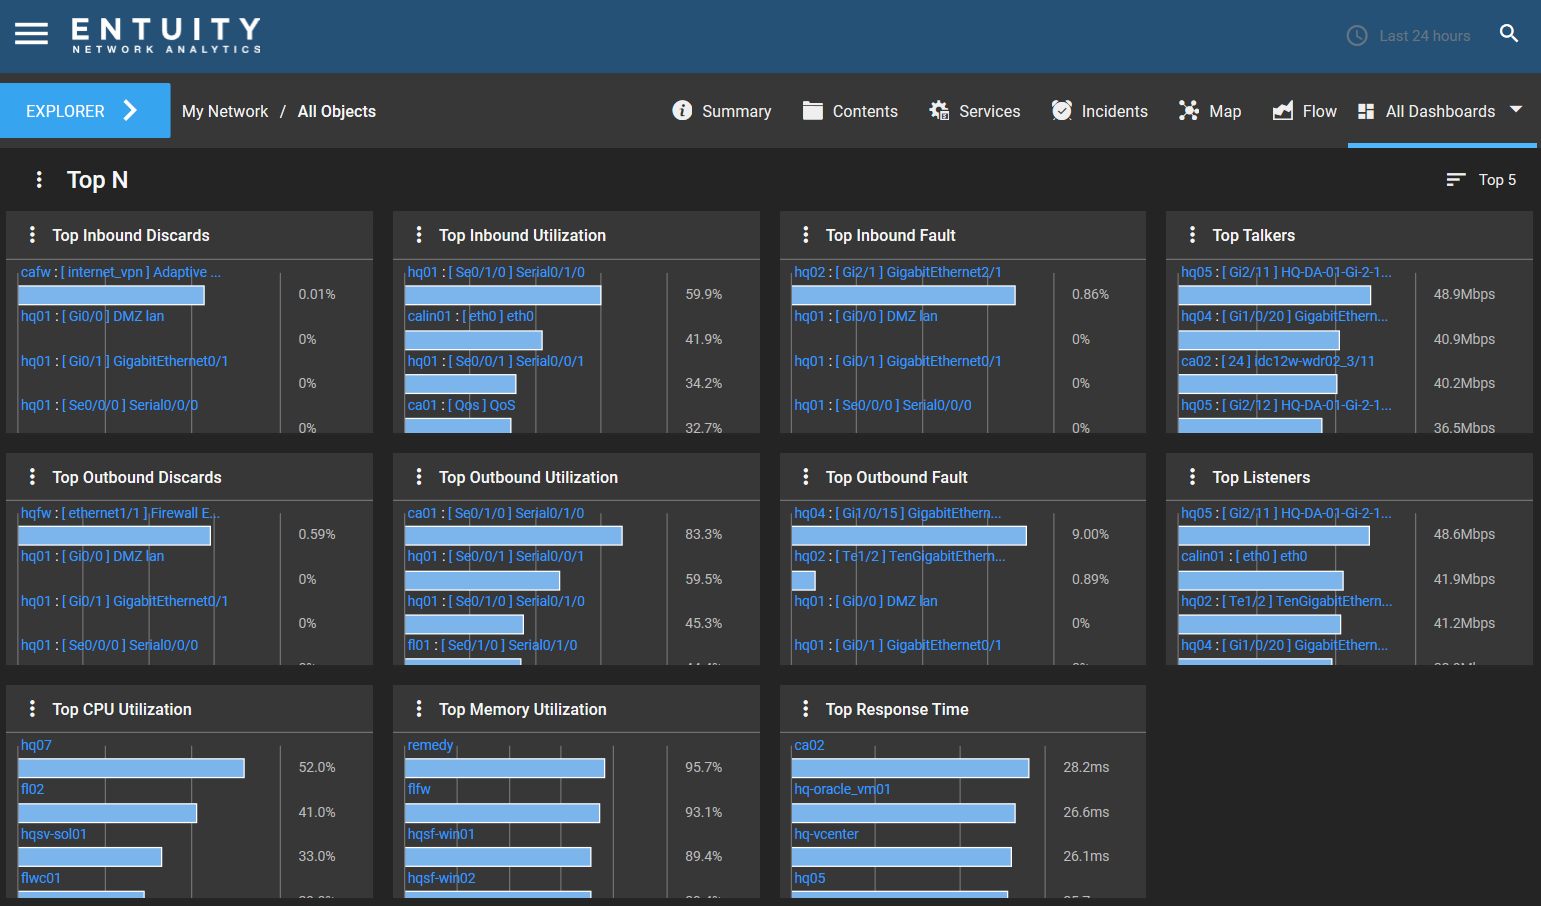
The TopN dashboard summarizes the performance of managed objects in a selected View or Subview. These summaries display the objects with the highest value metrics in the selected View/Subview for each metric type, so you can see the most active ports and devices within your selection. By default, the TopN dashboard will auto refresh as the details for your ports change.

The TopN dashboard shows the five objects with the highest value metrics for each metric type. If you create a duplicate of this dashboard, or use a TopN Summary dashlet in another custom dashboard, you are able to choose whether the top 5, 10 or 20 objects are displayed.
The TopN dashboard is only applicable to Views or Subviews. It is not applicable to any other data source (e.g. devices, services, components etc).
All dashlets on the TopN dashboard are TopN Summary dashlets. They display the following information, 8 applying to ports and 3 applying to devices:
- Top Inbound Discards - the top 5 objects in the selected View/Subview with the most inbound packets discarded, measured as a percentage of total traffic volume received over the polling period. This is port-level.
- Top Outbound Discards - the top 5 objects in the selected View/Subview with the most outbound packets discarded, measured as a percentage of total traffic volume transmitted over the polling period. This is port-level.
- Top Inbound Utilization - the top 5 objects in the selected View/Subview with the highest inbound utilization, measured as a percentage of total total inbound traffic over the polling period. This is port-level.
- Top Outbound Utilization - the top 5 objects in the selected View/Subview with the highest outbound utilization, measured as a percentage of total total outbound traffic over the polling period. This is port-level.
- Top Inbound Fault - the top 5 objects in the selected View/Subview with the most inbound faults, measured as a percentage of total inbound traffic over the polling period. This is port-level.
- Top Outbound Fault - the top 5 objects in the selected View/Subview with the most outbound faults, measured as a percentage of total outbound traffic over the polling period. This is port-level.
- Top Talkers - the top 5 talking objects in the selected View/Subview, measured in octets (bytes per second) over the polling period. This is port-level.
- Top Listeners - the top 5 listening objects in the selected View/Subview, measured as inbound traffic in octets (bytes per second) over the polling period. This is port-level.
- Top CPU Utilization - the top 5 objects in the selected View/Subview with the highest CPU utilization, measured as a percentage of total available CPU over the polling period. This is device-level.
- Top Memory Utilization - the top 5 objects in the selected View/Subview with the highest memory utilization, measured as a percentage of total available memory over the polling period. This is device-level.
- Top Response Time - the top 5 objects in the selected View/Subview with the longest response time from Entuity sending an ICMP ping request to an IP address and receiving a response, measured in milliseconds. This is device-level.
Please refer to this article for help and information on how to set and change TopN values throughout the UI (across dashboards that have a dashlet/dashlets that have TopN values applicable).

Comments
0 comments
Please sign in to leave a comment.