
To run a Device Reboot Summary report
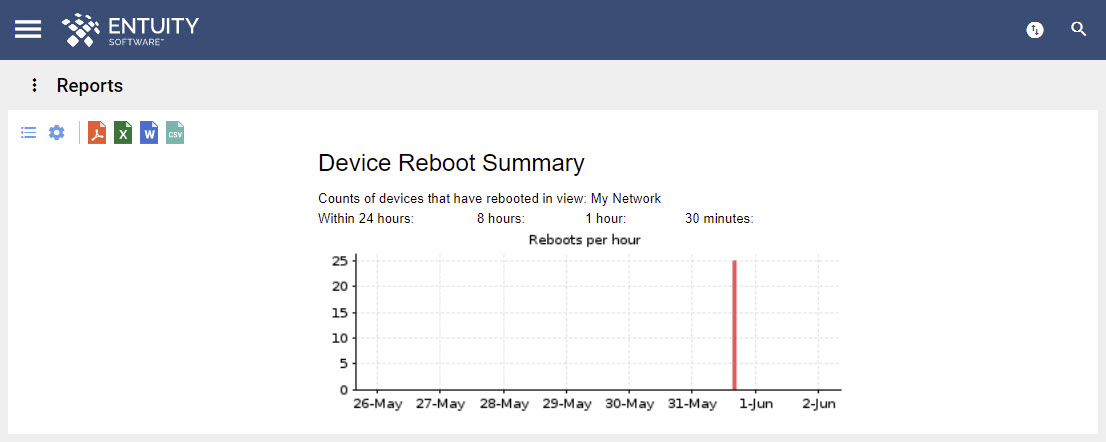
The Device Reboot Summary report charts, in 30 minute blocks, the number of reboots of devices within the selected View, on the selected server or servers.
The report includes 4 summaries for the number of devices that had reboots:
- within the last 24 hours,
- within the last 8 hours,
- within the last 1 hour,
- within the last 30 minutes.
Click on the count of each to run a Device Reboot Details report in that context.
In the chart, a tooltip appears when you hover a column, displaying the following details:
- total number of reboots.
- total number of devices that had reboots.
- names of devices with reboots and their number of reboots.
Device Reboot Summary report details:
| Name | Description |
|---|---|
| Counts of devices with reachability state transitions in View | Entuity View against which the reports are run. |
| Module Changes | Each column represents the number of devices with a module change within the 30 minute period. |
To run a Device Reboot Summary report:
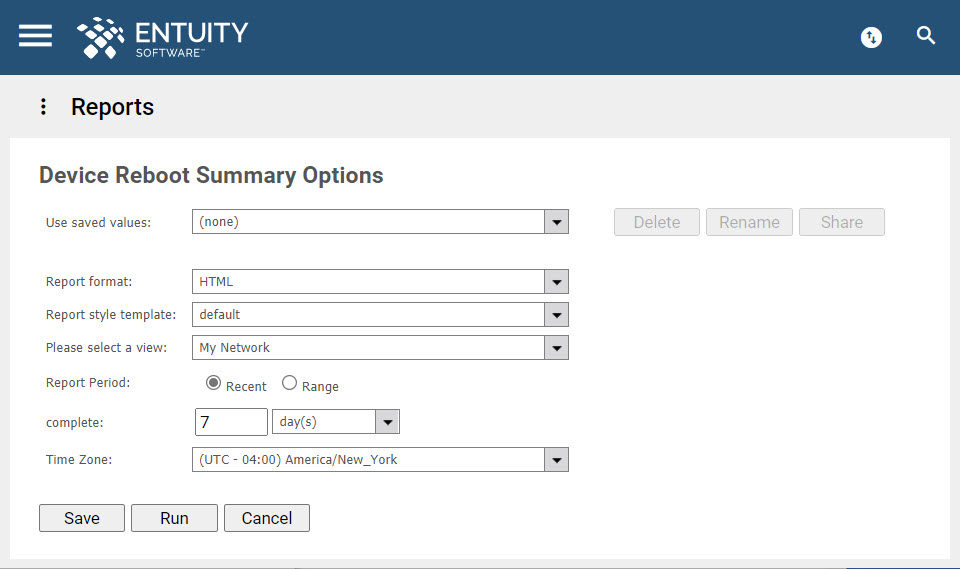
- In the Main Menu, click Reports.
- This will open the Reports page. Click Dashboard Panels.
- This will open the Dashboard Panels page. Click Device Reboot Summary.
- This will open the Device Reboot Summary Options page.
- If you want to reuse previously saved report values, select it in the Use saved values dropdown field.
- Specify the format of the report in the Report format field.
- Specify the View containing the service against which the report is to be run in the Please select a View dropdown field. From ENA v18.0 P06 upwards, you can drag Views into this field from the Drop Box.
- Specify if you want the Report Period to be a Recent period or across a Range.
- ENA v17.0 P08 upwards: Specify the time zone to which you want the reporting period to apply. By default, this is set to None, which means that the time zone of the host/consolidation server is used.
- Click Save to save your report values, Run to run immediately, or click Cancel.
Comments
0 comments
Please sign in to leave a comment.