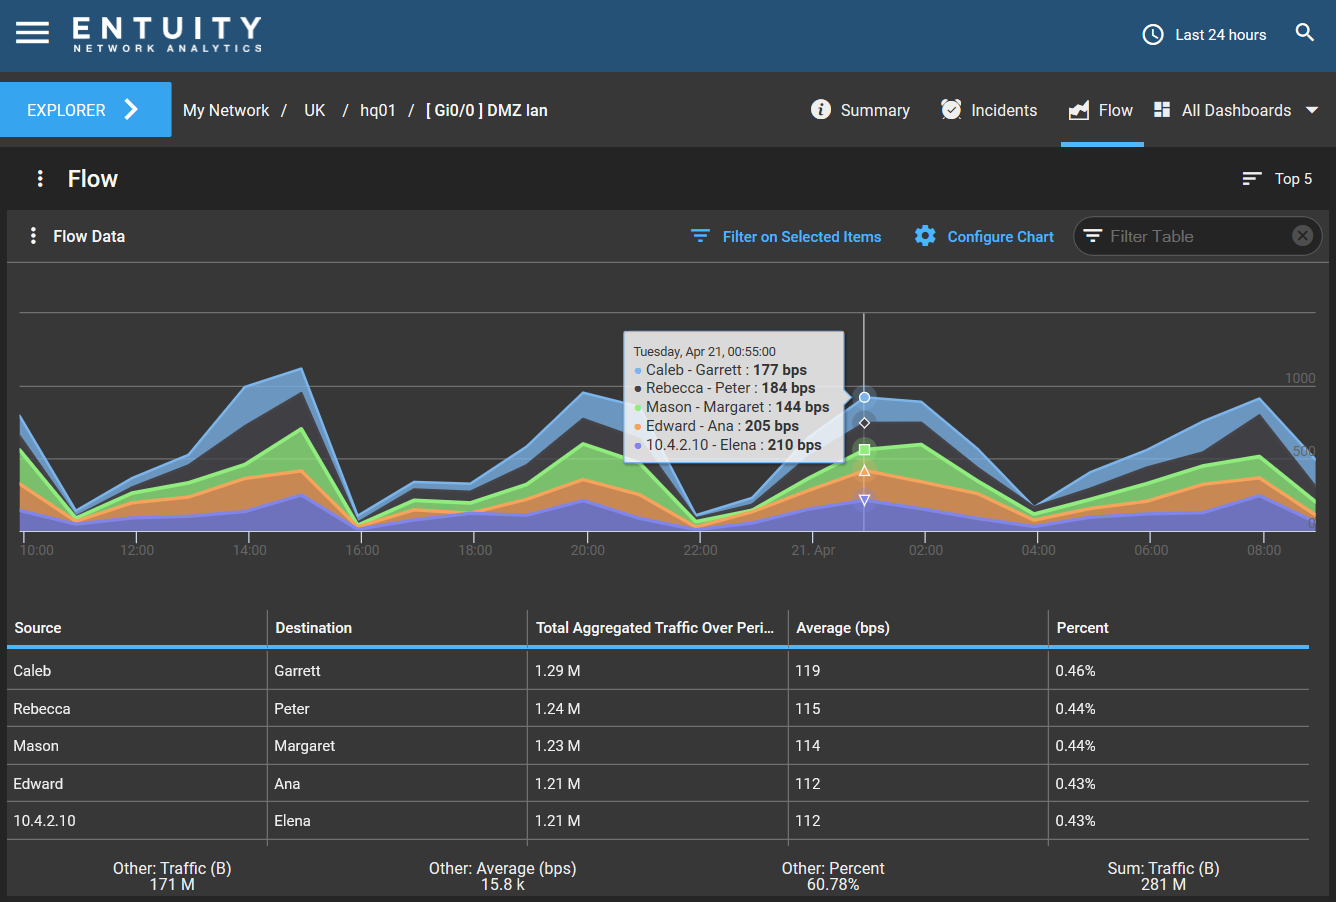
The Flow dashboard gives you a summary of flow information for the selected managed object. Flow data gives you information on network congestion, applications consuming high bandwidth percentages, and the destination of network traffic. Please see the Flow section for further information on flow collection in Entuity.
This is a dynamic dashboard. This means that this dashboard is context-specific, so the information (provided by dashlets) it displays will change depending upon the context (i.e., object type) in which it is opened.
- For example, the Flow dashboard will display the same set of dashlets for all Views, and will display a different set of dashlets for all devices.
The Flow dashboard is a system dashboard. This means that you cannot edit the settings of the dashboard. However, you can create a copy of a system dashboard and edit that copy as you want.
The Flow dashboard is only available when you have selected a device, port or View.
For a View/Subview:
- Flow List - this is a Flow-Enabled Devices dashlet. This dashlet lists the devices and ports enabled for flow in the selected View or Subview.
- Flow Data - this is a Flow Data dashlet. This dashlet displays flow data for the selected flow-enabled device in the Flow List dashlet.
You will need to select a flow-enabled device in the Flow List dashlet in order to populate the Flow Data dashlet.
For a device:
- Flow Summary - this is a Flow Summary dashlet.
- Flow Data - this is a Flow Data dashlet. This dashlet lists the devices and ports enabled for flow in the selected device.
- Flow List - this is a Flow-Enabled Devices dashlet. This dashlet displays flow data for the selected device.
For a component:

- Flow Data - this is a Flow Data dashlet. This dashlet lists the devices and ports enabled for flow in the selected component.

Comments
0 comments
Please sign in to leave a comment.