
To run the Port Util and Faults Chart report
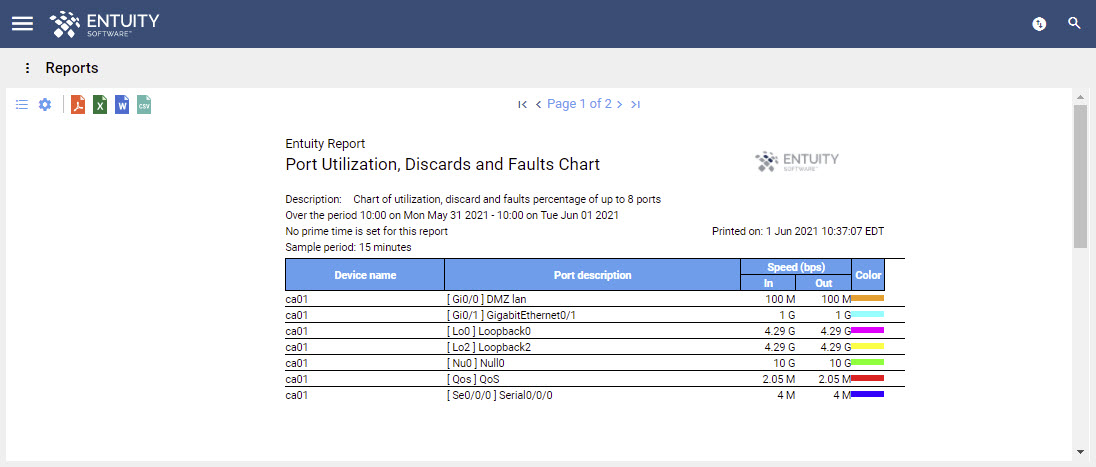
The Port Util and Faults Chart report displays a summary table and 6 charts for inbound and outbound utilization, fault and discard data from up to 8 ports. The charts are as follows:
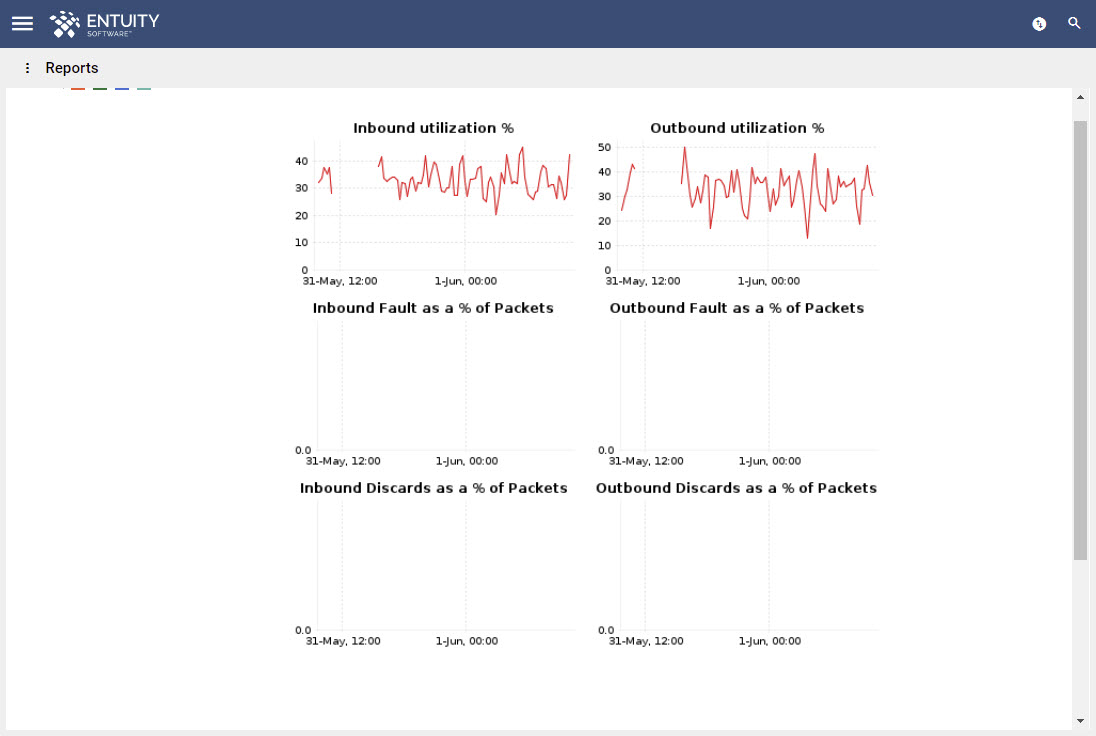
- inbound utilization % - inbound utilization of the port as a % of the referenced port speed.
- outbound utilization % - outbound utilization of the port as a % of the referenced port speed.
- inbound fault as a % of packets - inbound faults over the specified reporting period as a % of the ttoal number of packets transmitted by the port.
- outbound fault as a % of packets - outbound faults over the specified reporting period as a % of the ttoal number of packets transmitted by the port.
- inbound discards as a % of packets - inbound discards over the specified reporting period as a % of the total number of packets received by the port.
- outbound discards as a % of packets - outbound discards over the specified reporting period as a % of the total number of packets received by the port.
To run the Port Util and Faults Chart report:
- In the Main Menu, click Reports.
- This will open the Reports page. Click Activity Reports.
- This will open the Activity Reports page. Click Port Util and Faults Trend.
- This will open the Port Util and Faults Trend Options page.
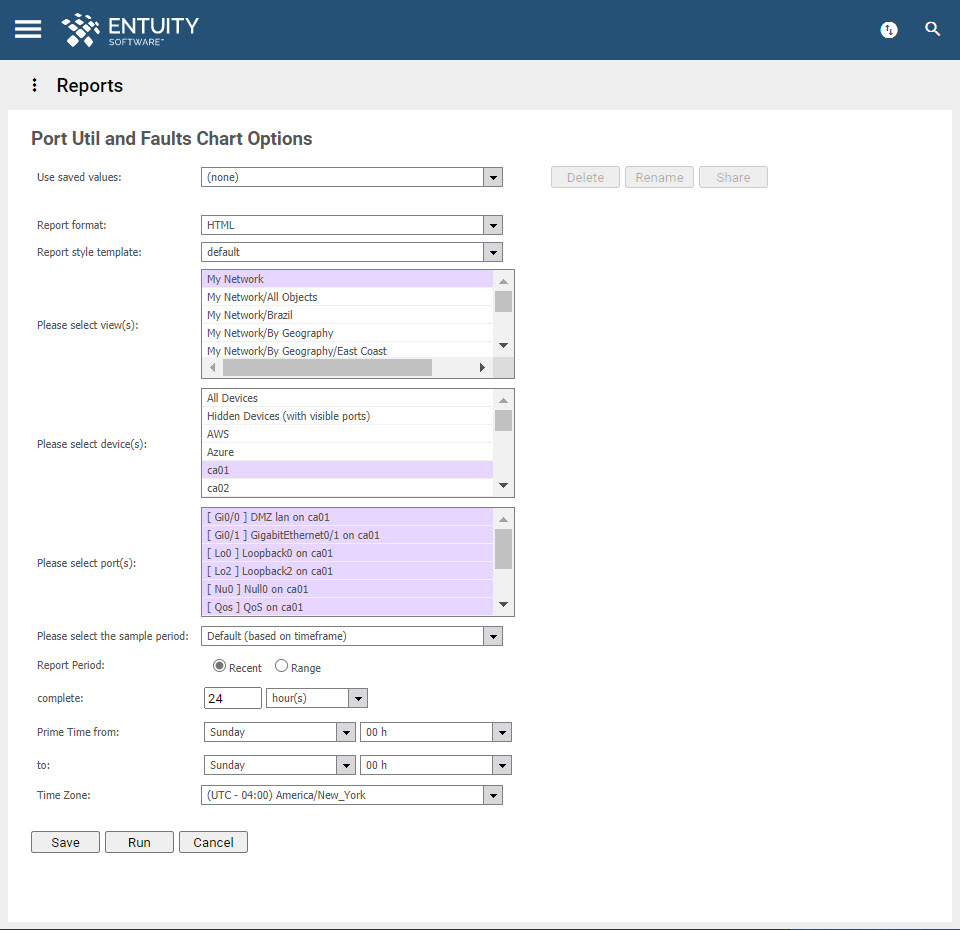
- If you want to reuse previously saved report values, select it in the Use saved values dropdown field.
- Specify the format of the report in the Report format field.
- Specify the View against which the report is to be run in the Please select View(s) dropdown field. From ENA v18.0 P06 upwards, you can drag Views into this field from the Drop Box.
- Specify the device against which the report is to be run in the Please select device(s) dropdown field.
- Specify the port against which the report is to be run in the Please select port(s) dropdown field.
- Specify the port utilization sample period in the Sample Period field.
- Specify if you want the Report Period to be a Recent period or across a Range.
- Specify the time within the reporting period for which the report is applicable in the Prime Time fields, e.g. between 09:00 and 17:00 each day.
- ENA v17.0 P08 upwards: Specify the time zone to which you want the reporting period to apply. By default, this is set to None, which means that the time zone of the host/consolidation server is used.
- Click Save to save your report values, Run to run immediately, or click Cancel.
Comments
0 comments
Please sign in to leave a comment.