
To run the Switching Summary report
The Switching Summary report displays a summary of devices that provide layer 2 switching services. This report enables you to see information for one or more selected switches within a selected view.
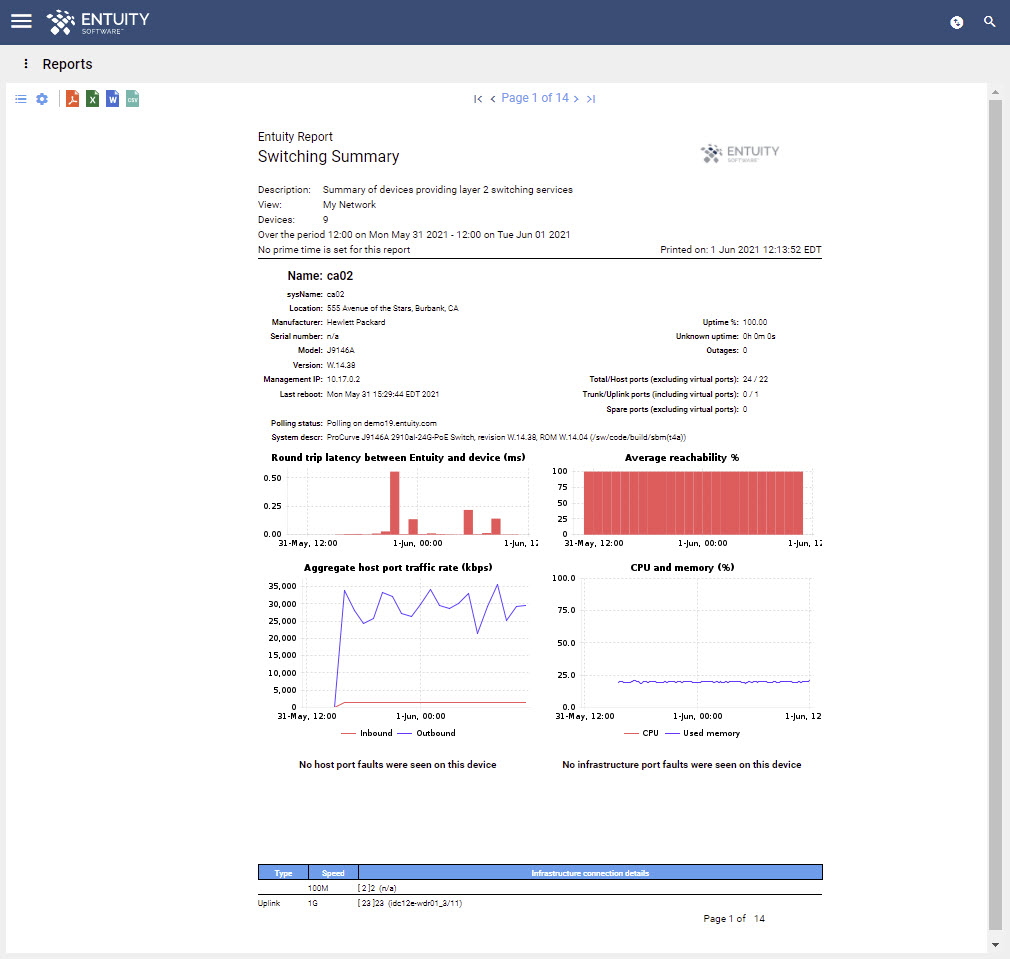
Switching Summary report details:
| Name | Description |
|---|---|
| sysName | switch system name or, where not available, the IP address |
| Location | SysLocation, or where not available it is left blank. |
| Manufacturer | device manufacturer. |
| Serial Number | device serial number. |
| Model | device model. |
| Version | device version number. |
| Management IP | IP address that Entuity uses to poll the device. |
| Last reboot | time of the last device reboot. |
| Polling status | status of Entuity SNMP polling of the device, i.e. Polling, Non-Polling. |
| System descr | system description, which for a Cisco device is a parsed sysDesc with model, versrion and serial number. |
| Uptime % | amount of time the switch is known to be up, as a % of the reporting period. |
| Unknown uptime | amount of time Entuity estimates the device was up when Entuity could not poll for its true state. |
| Outages | number of outages on the device during the reporting period. |
| Total/Host Ports (excluding virtual ports) | number of ports on the device, excluding virtual port. |
| Trunk/Uplink Ports (including virtual ports) | number of infrastructure ports on the device, including virtual port. |
| Spare Ports (excluding virtual ports) | number of spare ports on the device, excluding virtual port. |
| Round Trip Latency between Entuity and the device | round trip latency between Entuity server and the host, in miliseconds. |
| Average Reachability % | amount of time the device responds to ping, as a % of the reporting period. |
| Aggregate host port traffic | aggregated inbound and outbound traffic on the host port. |
| CPU and memory | graph charts router CPU utilization and memory usage over the reporting period. |
| Host Port Faults | number of faults on the host port. |
| Infrastructure Port Faults | number of faults on infrastructure ports. |
| Type | infrastructure port type, i.e. trunk, uplink. |
| Speed | port's referenced interface speed, used e.g. when Entuity calculates port utilization. Administrators can amend the port interface speed. |
| Description | description of the device and its interface. |
To run the Switching Summary report:
- In the Main Menu, click Reports.
- This will open the Reports page. Click Activity Reports.
- This will open the Activity Reports page. Click Switching Summary.
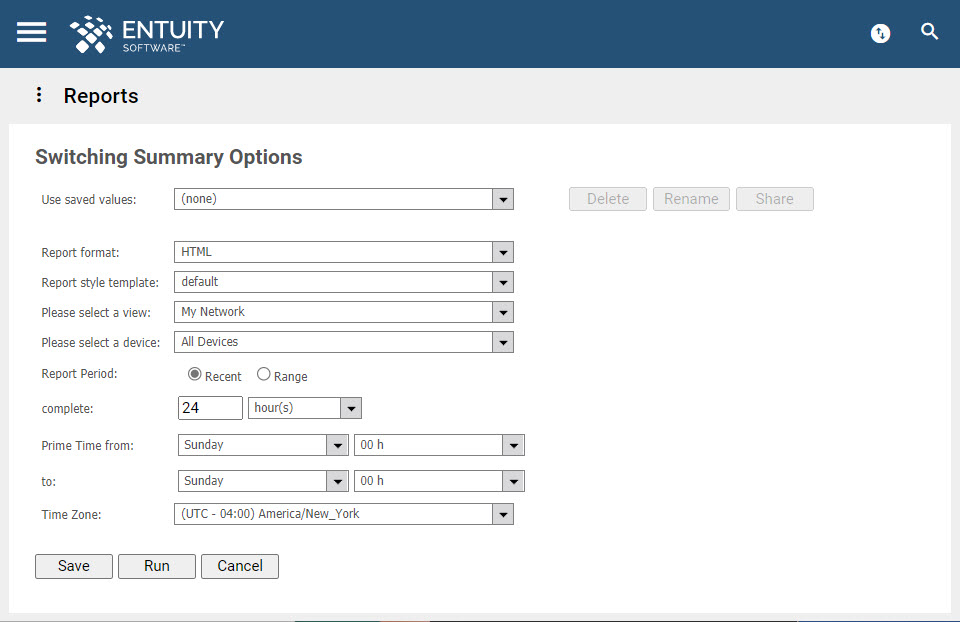
- This will open the Switching Summary Options page.
- If you want to reuse previously saved report values, select it in the Use saved values dropdown field.
- Specify the format of the report in the Report format field.
- Specify the View against which the report is to be run in the Please select a View dropdown field. From ENA v18.0 P06 upwards, you can drag Views into this field from the Drop Box.
- Specify the device against which the report is to be run in the Please select a device dropdown field.
- Specify if you want the Report Period to be a Recent period or across a Range.
- Specify the time within the reporting period for which the report is applicable in the Prime Time fields, e.g. between 09:00 and 17:00 each day.
- ENA v17.0 P08 upwards: Specify the time zone to which you want the reporting period to apply. By default, this is set to None, which means that the time zone of the host/consolidation server is used.
- Click Save to save your report values, Run to run immediately, or click Cancel.
Comments
0 comments
Please sign in to leave a comment.