
Applicable to Entuity v19.0 P02 upwards. Please note, this replaces the existing live ping status functionality in earlier versions of Entuity, help and information about which can be found here.
To view further information about Status Over Time
To access further functionality from Live Status
Introduction to Live Status:
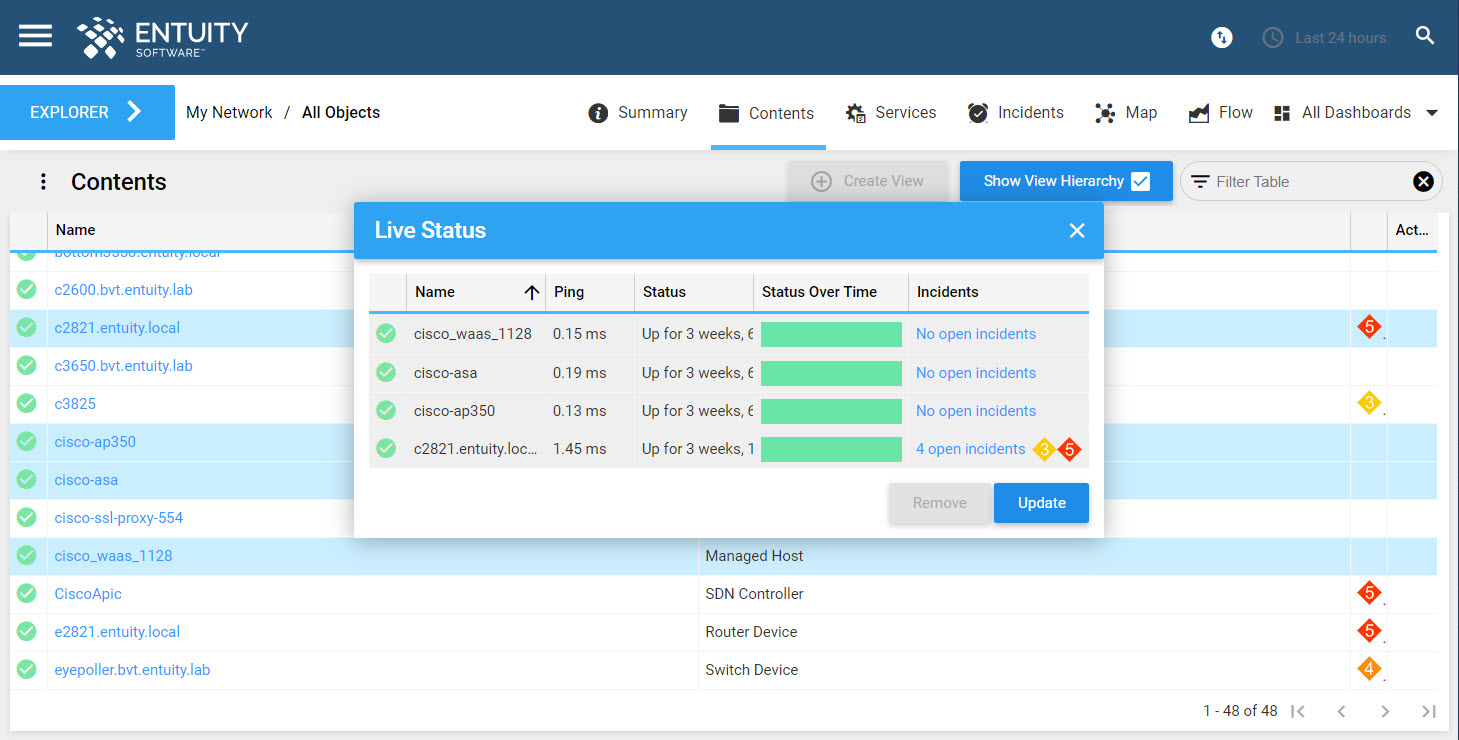
The Live Status dialog box provides quick access to the status and other high level data about selected objects. Live Status is available for the following objects:
- device.
- port.
- IP address.
- application.
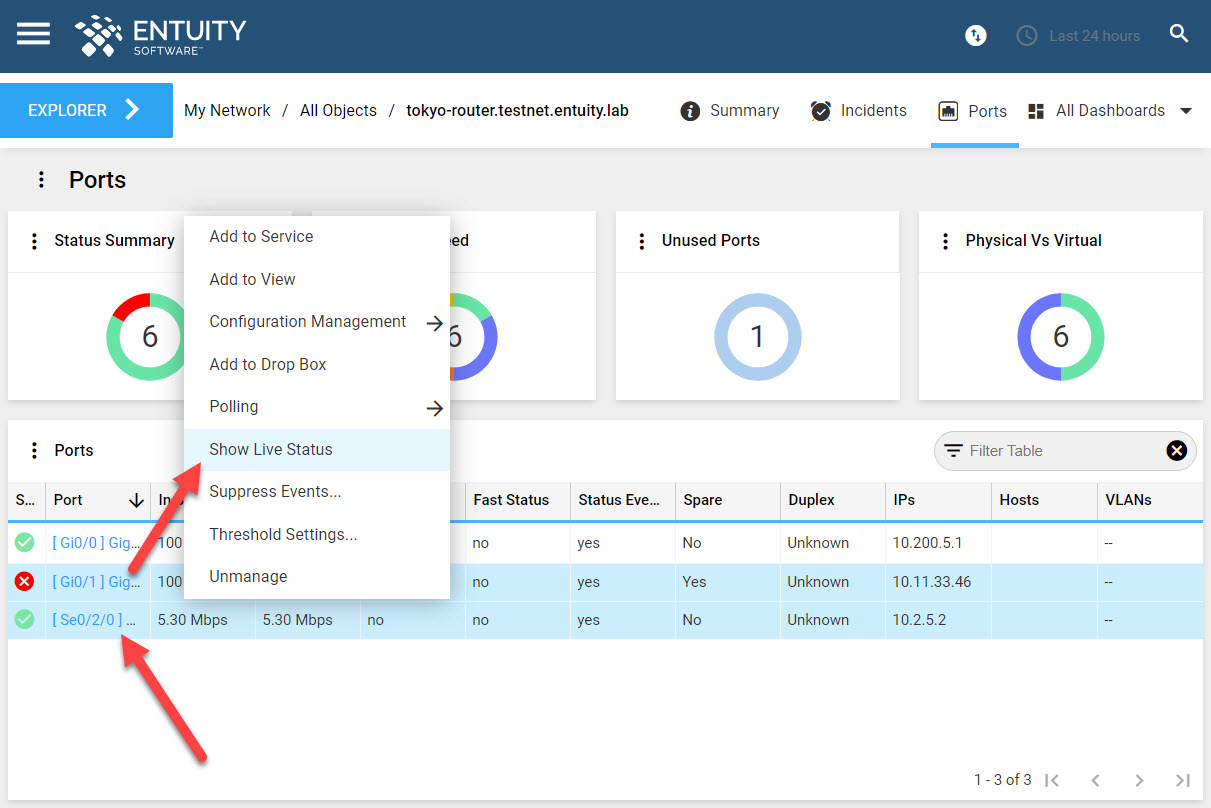
You can select one or multiple objects and open the Live Status dialog box from the right-click context menu.
Once the Live Status dialog box is open, you can drag more objects into it, up to a maximum of 10 objects. The box will automatically update with the newly added objects. You can drag an object from the same tab or from another tab.
You can remove objects from the Live Status box by selecting one or more objects and clicking Remove.
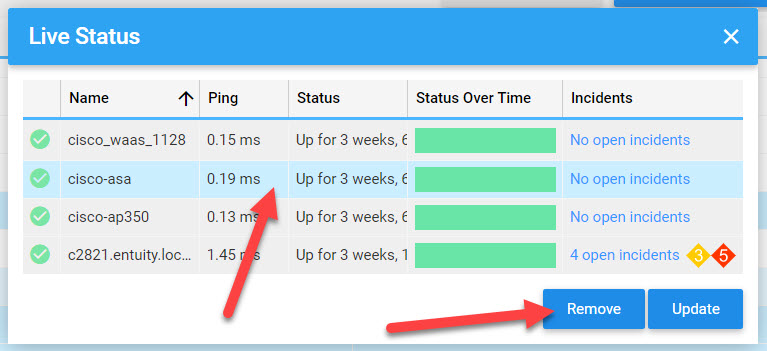
Click Update to refresh the data. This replaces the live Ping functionality in earlier versions of Entuity.
The content of the Live Status box is as follows:
| Column | Description |
|---|---|
| Object Status |
object status icon showing the current status of the object, as seen elsewhere in the Entuity UI. Please see this article for further information on object states in Entuity. |
| Name | display name of the object. For e.g. ports and applications, the name of the parent object will also be displayed. |
| Ping Status | the ping response time in milliseconds for pingable objects. Devices, IP addresses and applications are always pingable. Ports may or may not be pingable, depending on if they have an IP address associated with them. Click Update in the Live Status box to update the ping status. This replaces the existing live Ping functionality in earlier versions of Entuity. |
| Polled Status |
live status of the object via SNMP:
This is not applicable to IP addresses and applications. |
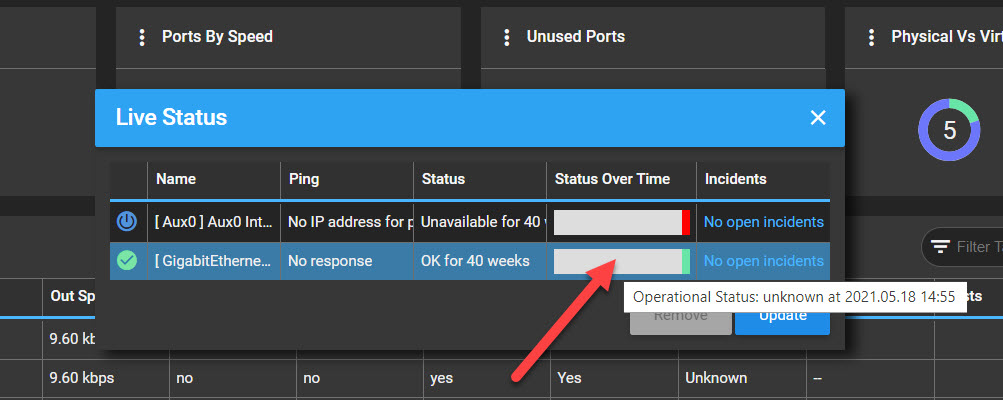
| Status Over Time |
a mini chart displaying the historical status (the last 24 hours) of the object:
When you hover over the chart, a tooltip will appear that shows the value at each timestamp. Click the chart to open a full chart of the data in a new tab. From Entuity v19.0 P03 upwards, when displaying the live status of an application, the drill down chart will display percentage-based hourly status information, showing the constituent percentages for OK, Admin Down, Uninitialized, Unknown, Degraded and Down for each hour. |
| Incidents | count of the total number of open incidents against the object, with an icon displaying the highest severity of these incidents. Click on the text in this column to open the Incidents dashboard for this object. |
To view further information about Status Over Time:
You can hover over the Status Over Time chart to see a tooltip that shows the value of the specified timestamp:
Click on a Status Over Time chart to open the chart in a new tab. From Entuity v19.0 P03 upwards, when displaying the live status of an application, the drill down chart will display percentage-based hourly status information, showing the constituent percentages for OK, Admin Down, Unitialized, Unknown, Degraded and Down for each hour.
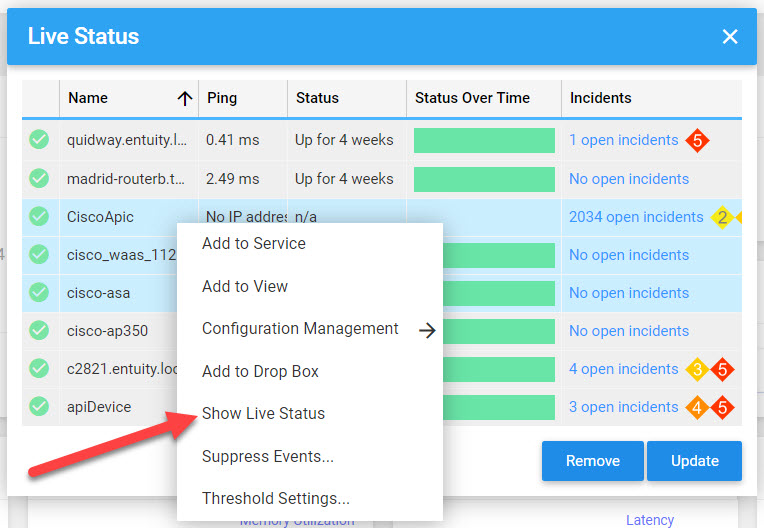
To access further functionality from Live Status:
You can right click on an object in the Live Status Dialog box for the context menu, including Add to Drop Box.
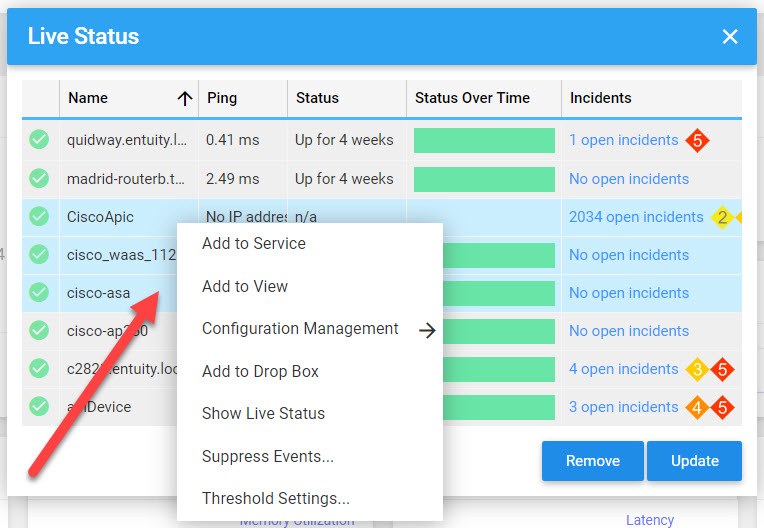
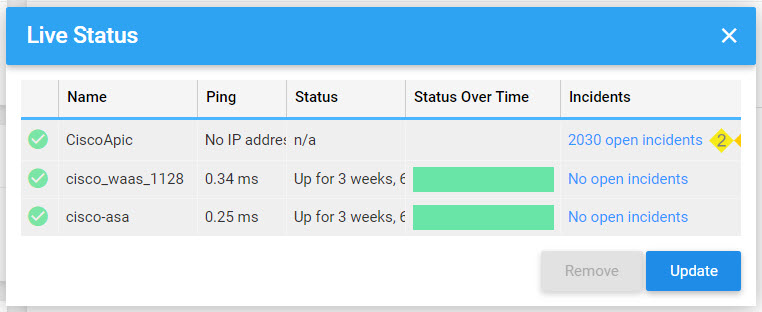
From this context menu, you can also click Live Status again. The Live Status dialog box will refresh and simply show the live status of the selected object(s).
Navigating the UI with the Live Status box:
With the Live Status dialog box open, you can navigate between dashboards. The Live Status box will remain open, meaning that you can add new objects to it from the new dashboards that you visit.
The Live Status dialog box will remain open until you close it, or if you navigate to a non-dashboard page (e.g. the Administration page).
Comments
0 comments
Please sign in to leave a comment.