
Applicable to ENA v18.0 P03 upwards. If you are using an older version of Entuity, please see this article.
To configure/edit a chart in runtime
To restore default chart settings
Introduction:
There are three ways to edit chart settings: from the chart in runtime, via Edit Dashboard, or by opening the chart in a New Tab.
To configure/edit a chart in runtime:
From ENA v18.0 P03 upwards, users can edit chart settings directly from the chart dashlet itself (i.e. live, or at runtime). These changes will be saved to the user's preferences, and therefore will be maintained during the login session and in subsequent login sessions until such time that the user edits the chart again.
- Navigate to the chart that you want to edit and click the Overflow Menu. Then click Configure Chart.
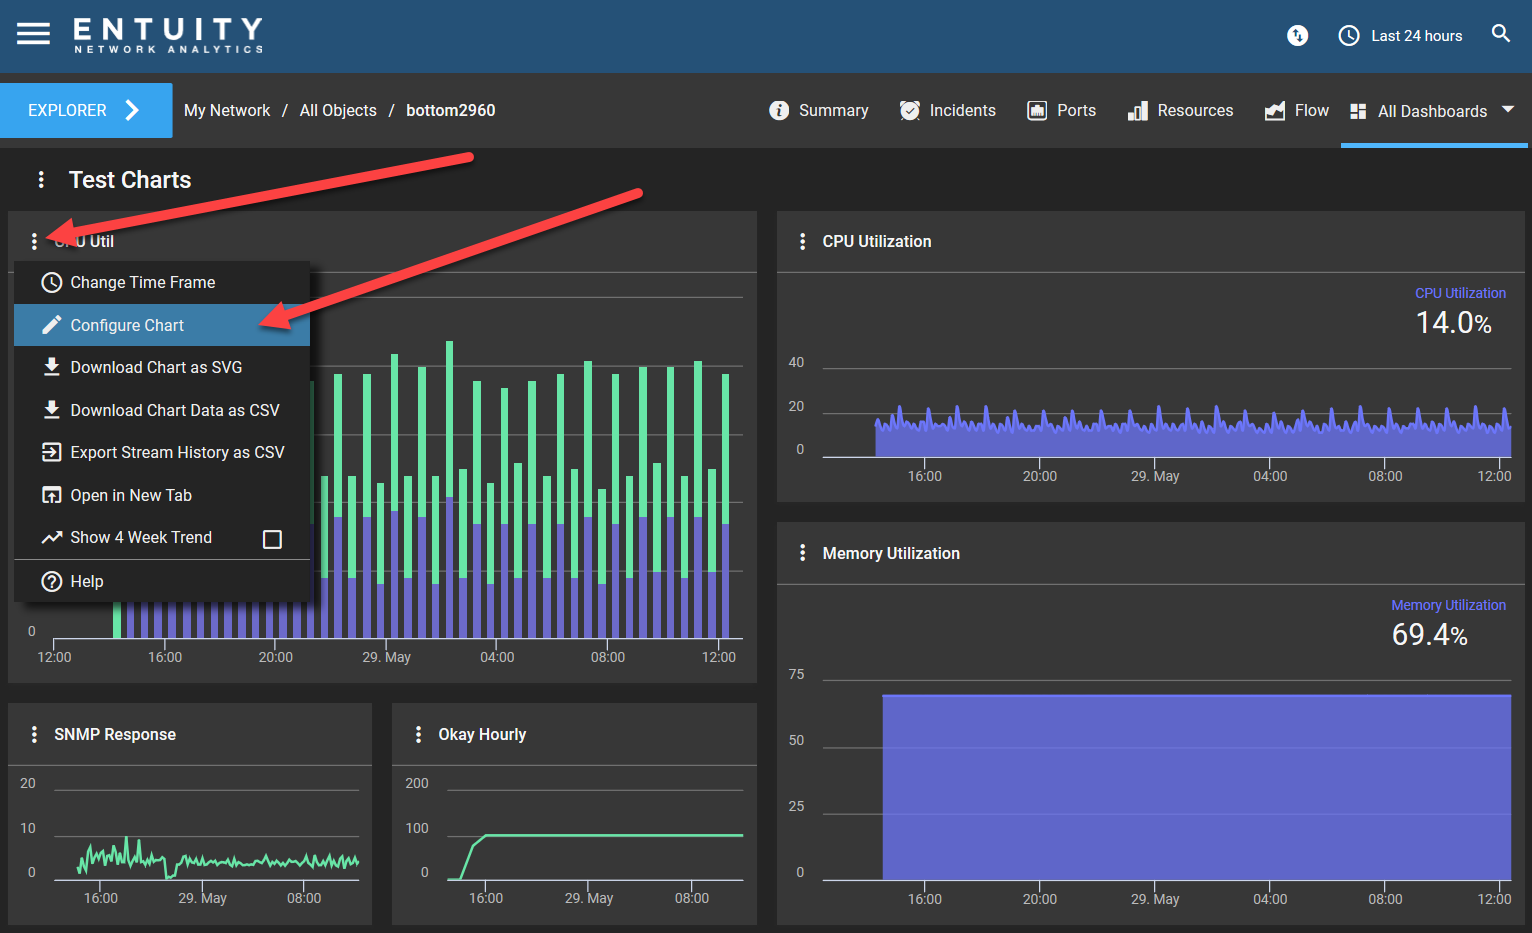
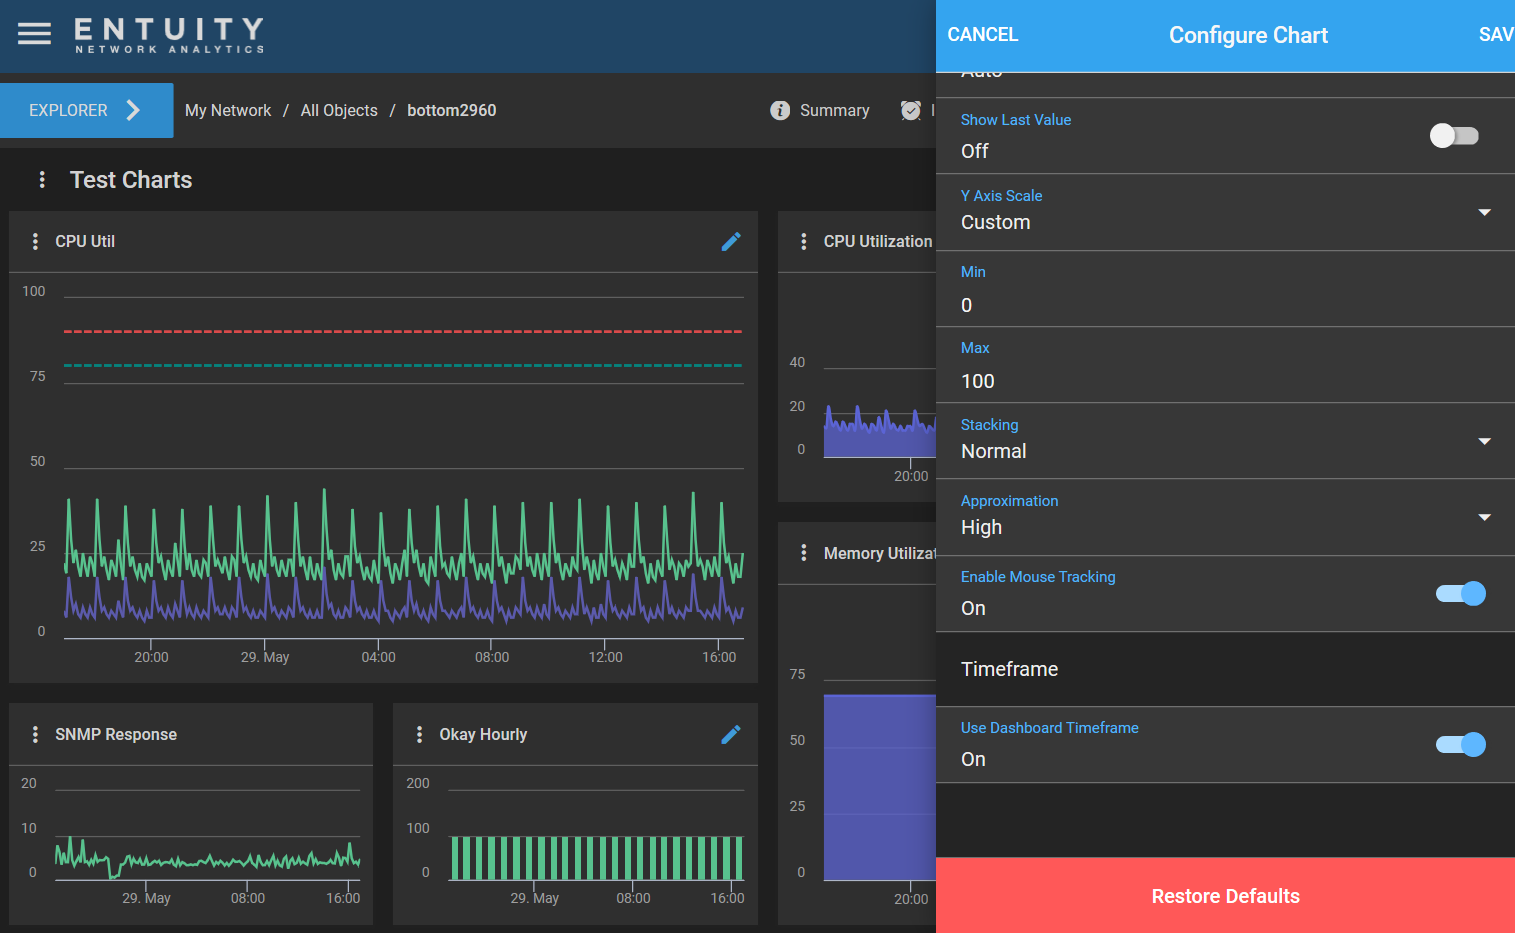
- This will open the Configure Chart form on the right side of the browser.
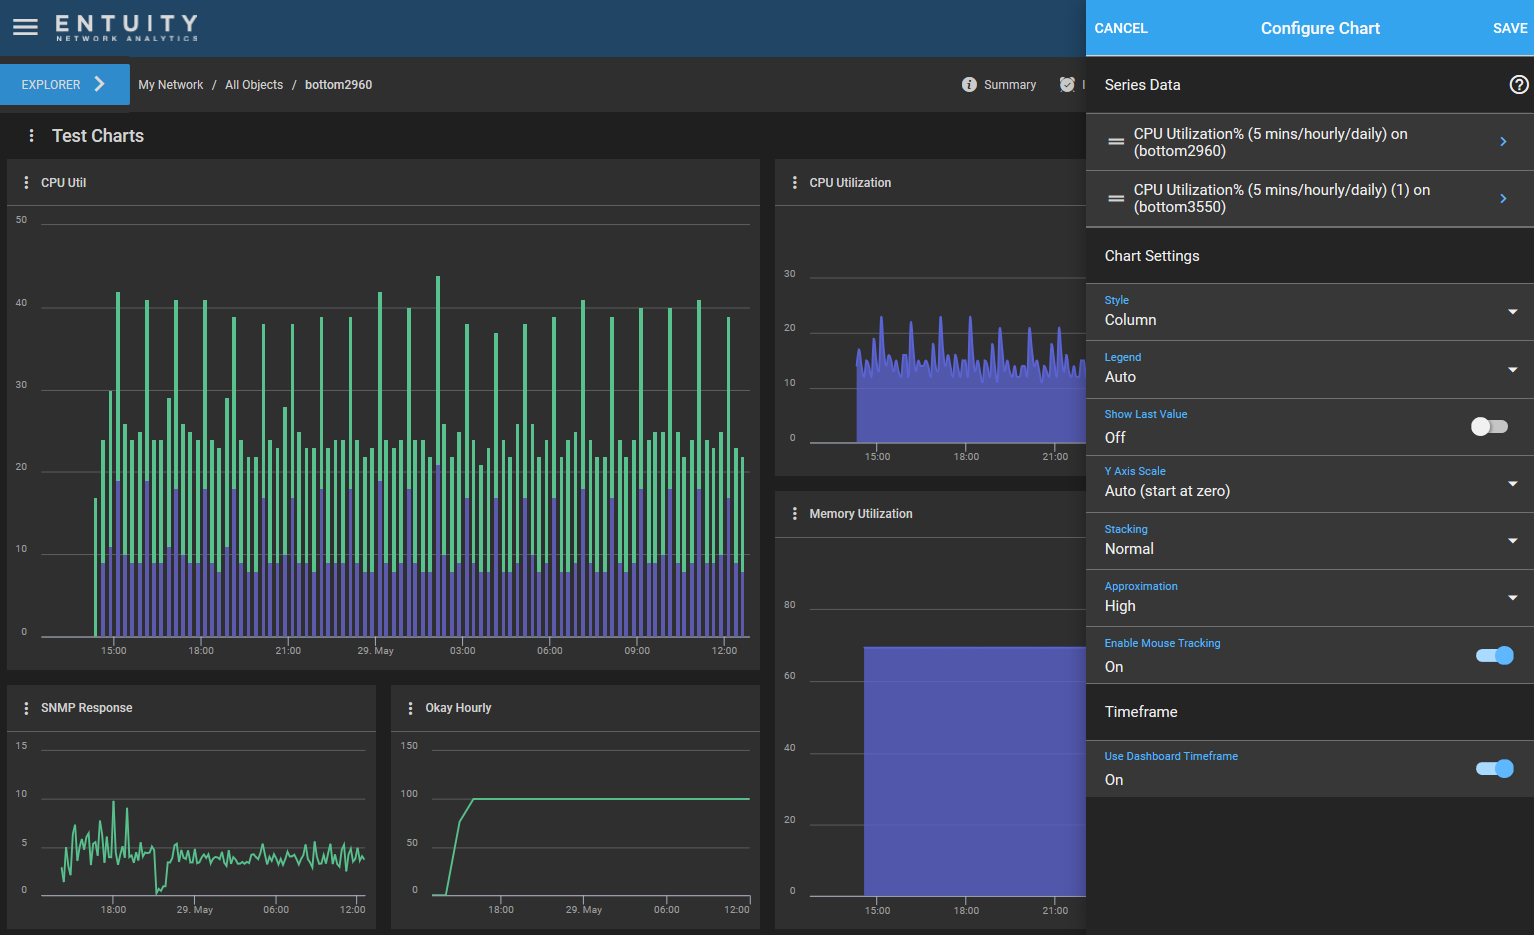
- This form differs slightly to the Edit Chart form that you access via the Edit Dashboard functionality.
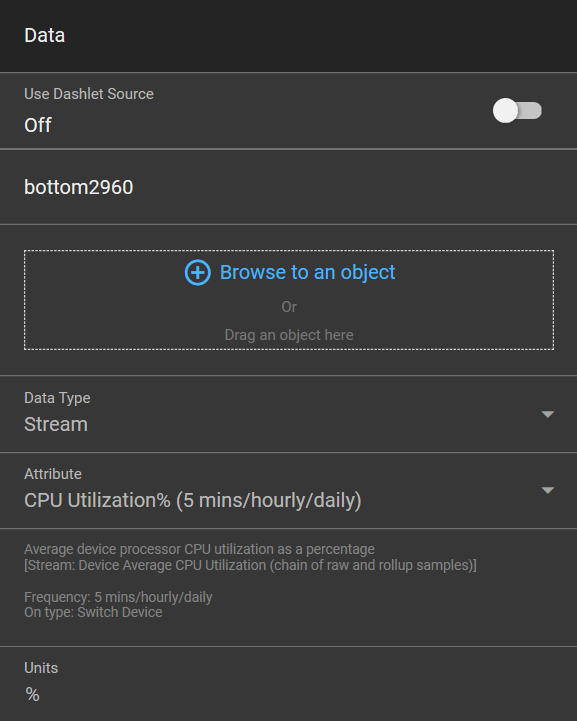
- At the top of this form are the series data that are currently included to the chart.

- You can drill down into the series data included to this chart. In this example, we will drill down into the series data 'CPU Utilization% (5 mins/hourly/daily) on (bottom2960).
- This will open the Edit Series form.
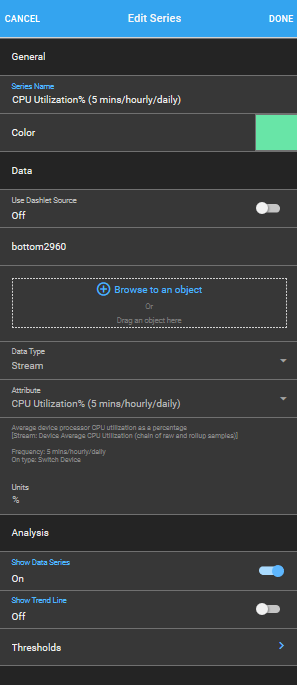
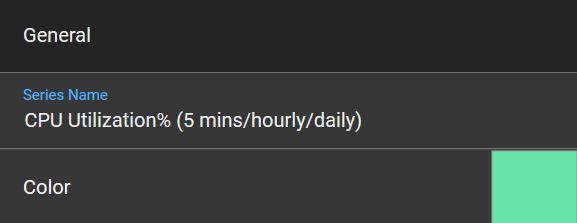
- In the General section, you can edit the Series Name and Color.
- In the Data section, you cannot edit any of the fields. You can only edit these fields via the Edit Dashboard page.
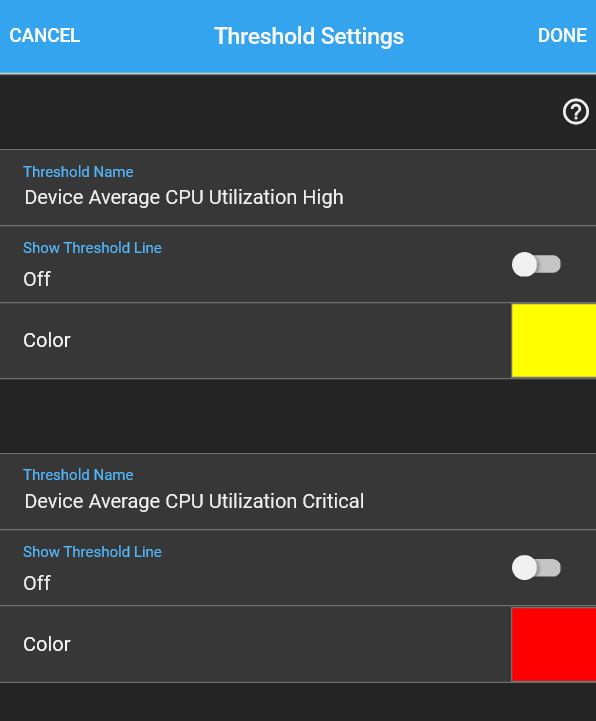
- In the Analysis section, you can specify whether to Show Data Series and Show Trend Line in the chart, or you can drill down into the Thresholds form.

- Click Done to save your changes and return to the Configure Chart form.
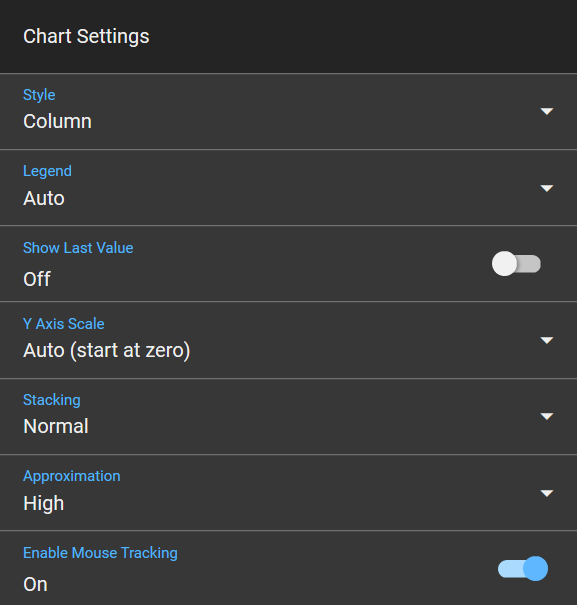
- Specify the general settings of the chart in the Chart Settings section.
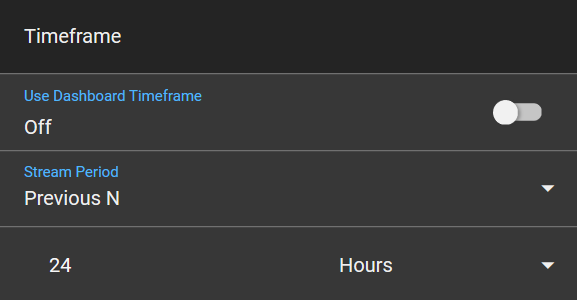
- Specify whether to display the dashboard timeframe. If turned off, you will be prompted to specify the timeframe to use. The timeframe, existing or changed, will be displayed in the top right of the chart dashlet.
- Click Save to save your changes, otherwise click Cancel.
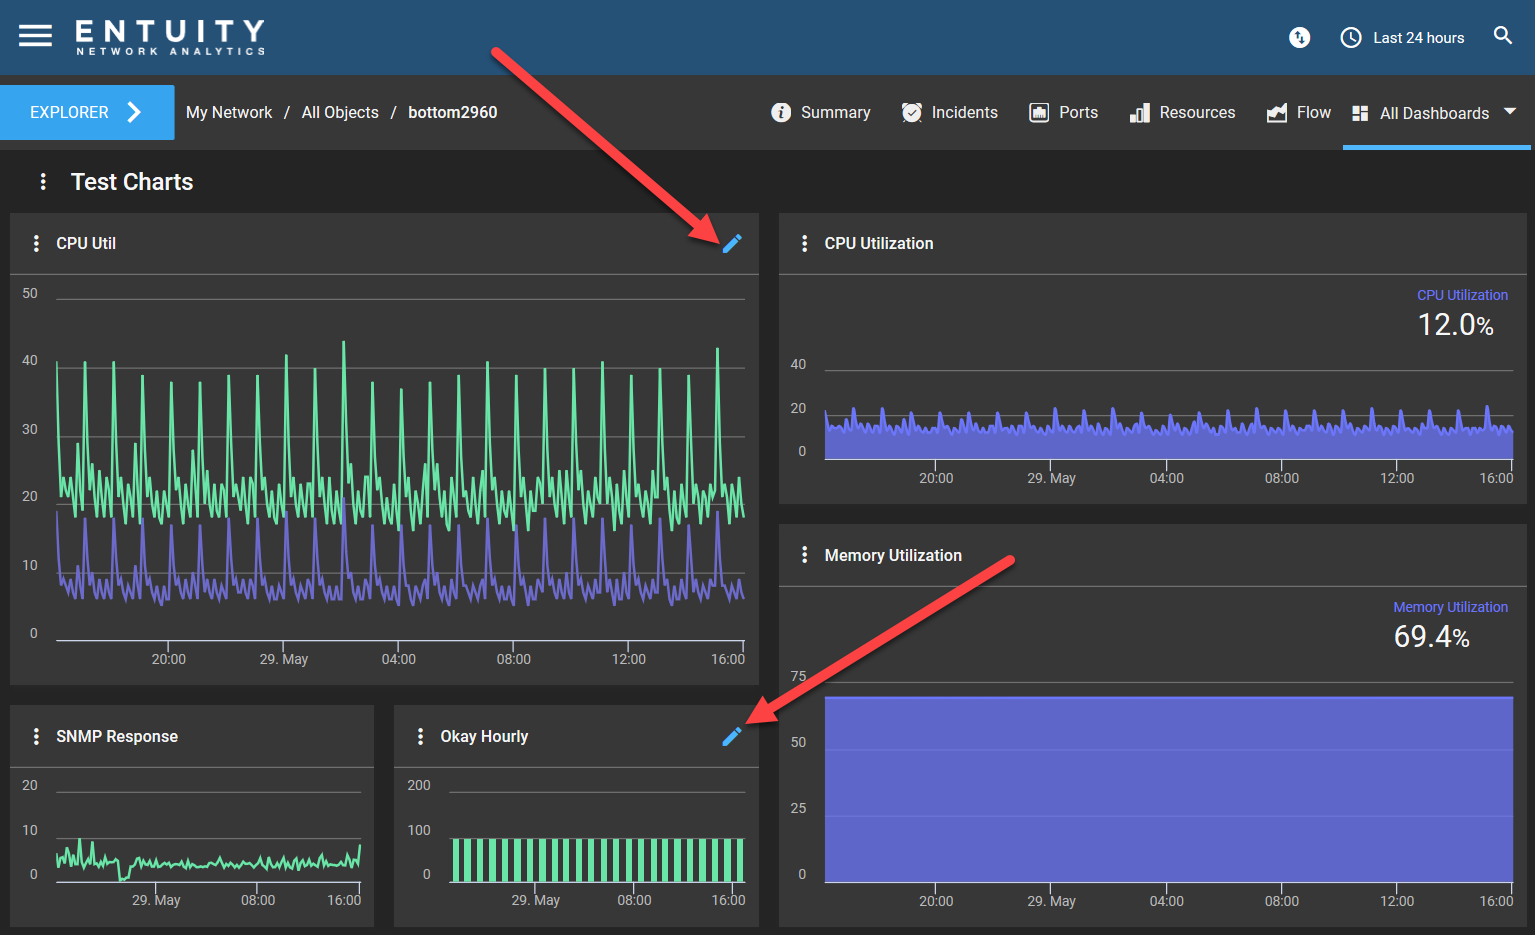
Once you have edited a dashlet in runtime, an edit icon ![]() will appear in the top right of the chart dashlet to denote that the chart has been edited from its original design time setting. You can click on the icon to reopen the Configure Chart form.
will appear in the top right of the chart dashlet to denote that the chart has been edited from its original design time setting. You can click on the icon to reopen the Configure Chart form.
To restore default chart settings:
To remove the changes that you have made to a chart dashlet:
- Open the Configure Chart form by clicking the edit icon
 or via Configure Chart in the dashlet Overflow Menu.
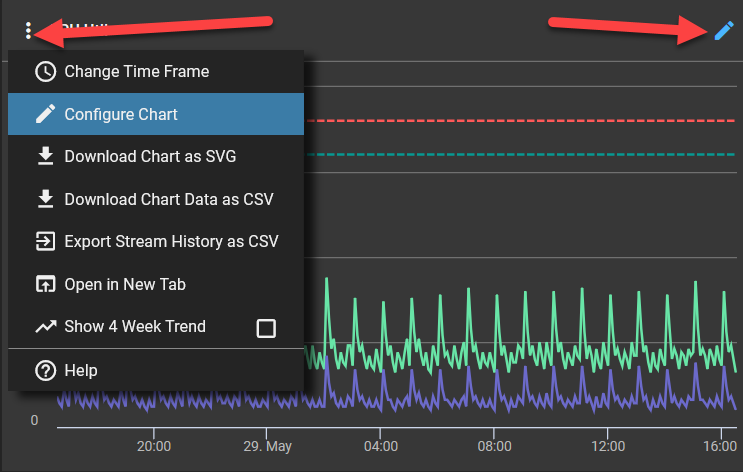
- At the bottom of the Configure Chart form, click Restore Defaults.
Via Edit Dashboard:
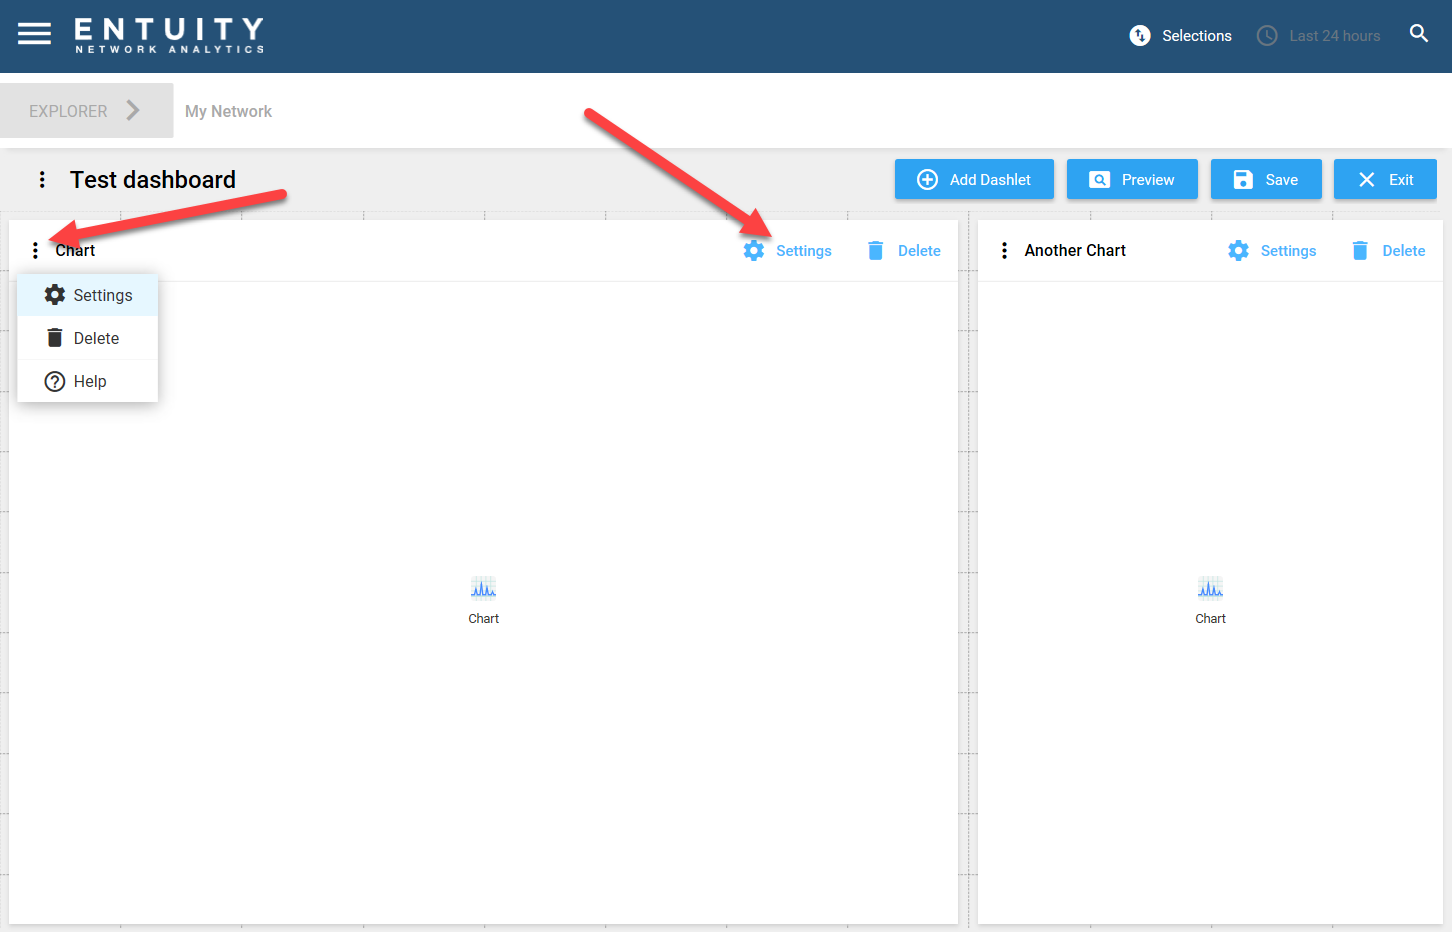
- Navigate to the Dashboard Configuration page. Select the dashboard containing the chart dashlet you want to edit, and click Edit Dashboard via right click or the Overflow Menu.

- This will open the edit dashboard page. Navigate to the chart dashlet that you want to edit, and click Settings in the top right of the dashlet or via the dashlet's Overflow Menu.
- This will open the Edit Dashlet form. This has the same fields as when you are creating a chart dashlet.
- Click Done in the top right of the form to save your changes, otherwise click Cancel.
Via New Tab:
- Navigate to the dashboard containing the chart dashlet that you want to edit. Click the Overflow Menu for the chart dashlet, and click Open in New Tab.
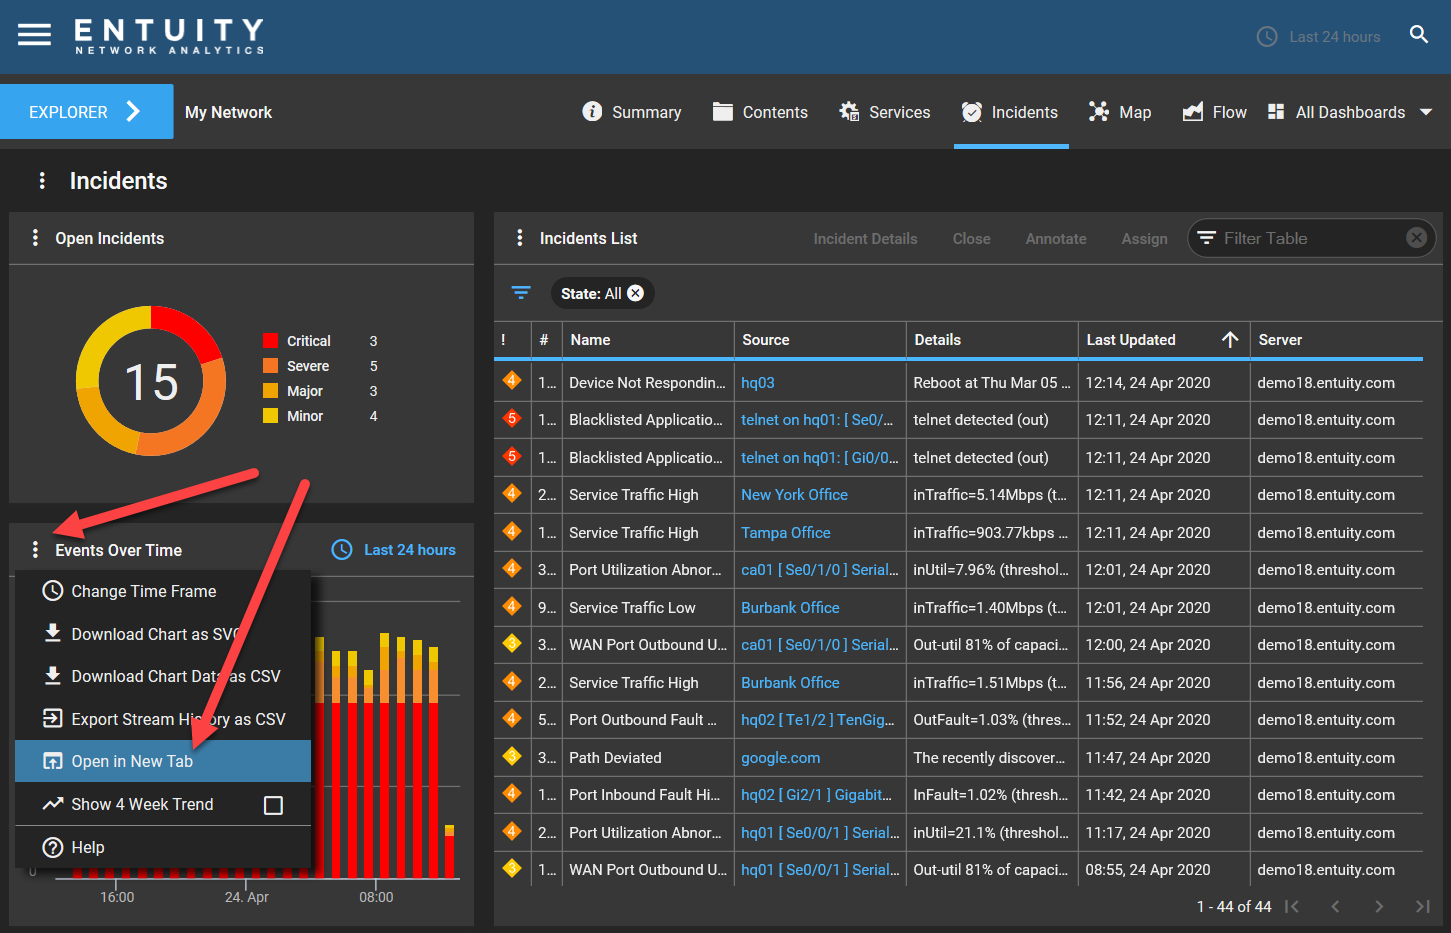
- This will open the chart in a new tab, taking the full size of the browser. In this new tab, click the Overflow Menu and then click Configure Chart.
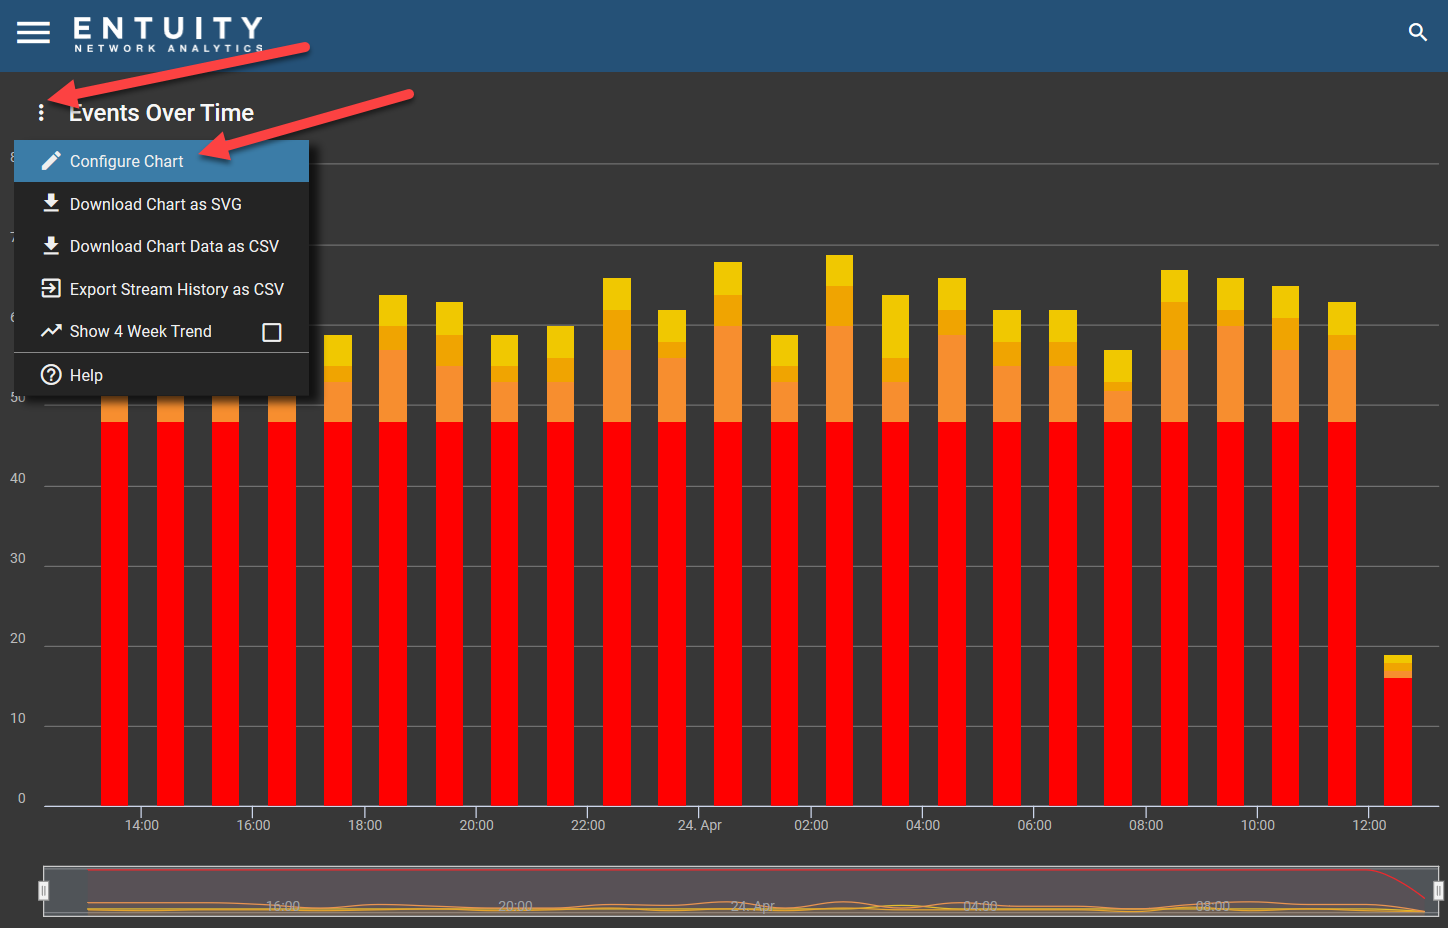
- This will open the Configure Chart form. From here, you can edit the Series Data and Chart Settings as you would when creating a new chart dashlet.
- Click Save in the top right of the form to save your changes, otherwise click Cancel
Comments
0 comments
Please sign in to leave a comment.