
To add a Traceroute dashlet to a custom dashboard
To configure or export the table in the dashlet
To view further details about the selected object's traceroute
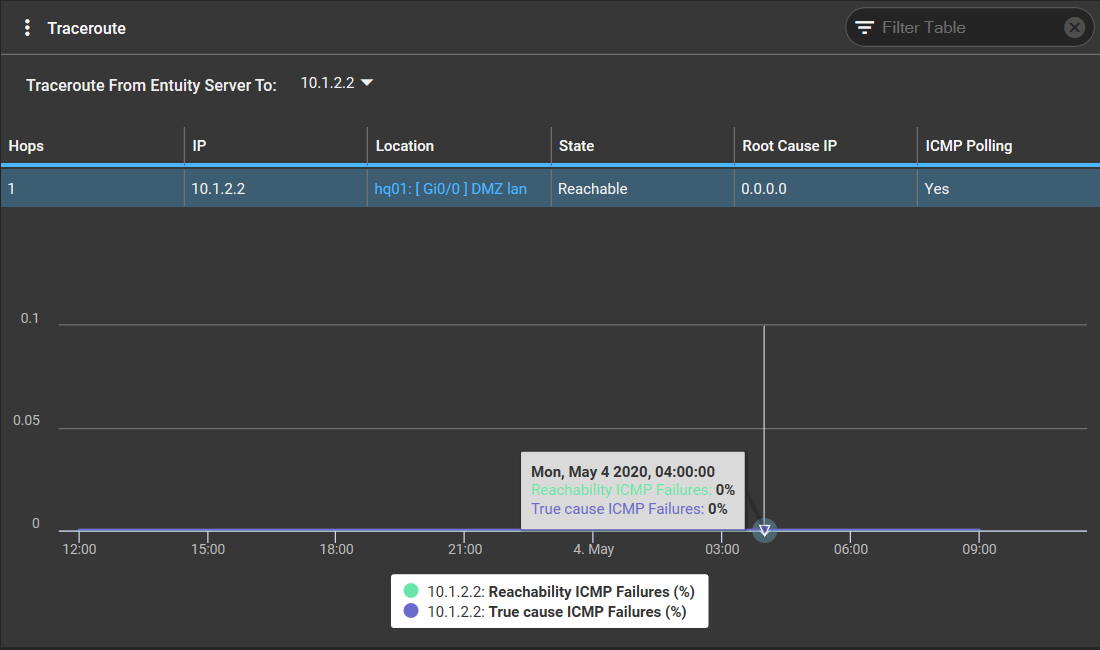
The Traceroute dashlet displays traceroute information for the selected device or VM platform. It displays the following:
- a table detailing the traceroute path from the Entuity server to the selected device.
- a graph showing the reachability history for each selected IP address, reporting the following metrics:
- True Cause ICMP Failure (%) - number of times traceroute failed to reach the IP address, when that address was the true cause of the problem, as a percentage of the number of times traceroute attempted to poll the IP address.
- Reachability ICMP Failures (%) - number of times traceroute failed to reach the IP address, as a percentage of the number of times traceroute attempted to poll the device.
The Traceroute dashlet is only applicable for devices and VM platforms. It is not applicable to other data sources (e.g. Views, components, services etc).
Every 10 minutes, Entuity applicationMonitor runs traceroute to create new traceroute paths of the network, and updates its list of discovered IP addresses. Every 2 minutes it pings IP addresses on that list, which updates the Traceroute dashlet. The Traceroute dashlet displays the traceroute path from the Entuity server to the selected device.
For further help and information on traceroute and ICMP ping monitoring, please see this section.
For further help and information on Entuity's proprietary SurePath traceroute technology, please see this section on Application Path Discovery.
To add a Traceroute dashlet to a custom dashboard:
- When adding a dashlet to a new custom dashboard or editing an existing custom dashboard, follow the instructions for adding a dashlet, select Traceroute in the Select Dashlet Type, and click Next.
- The Create Dashlet form will slide in on the right.
Dashlet Settings
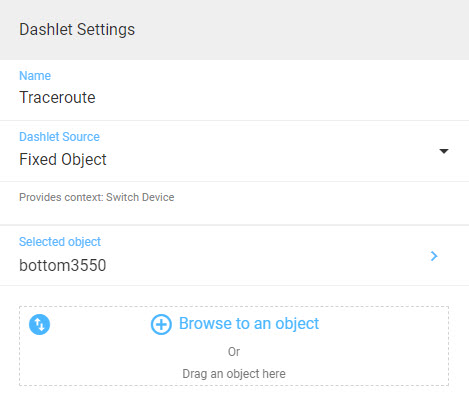
- Enter a name for your dashlet in the Name field.
- You can then choose the source of the data to be displayed in the dashlet.
The Traceroute dashlet can only display data where the source is a device or VM platform.
- If you want this dashlet to source its data from the context of its parent dashboard, select Dashboard. You can see the context of the parent dashboard in the Dashboard Context field at the top of the form.
- If you want this dashlet to source its data from another dashlet in this current dashboard, select Dashlet.
- If you want this dashlet to source its data from a specific device/VM platform on your network, select Fixed Object. You can then click Browse to an object to search for the device/VM platform in Explorer, or drag into the box your desired device/VM platform in from another browser window.
Data
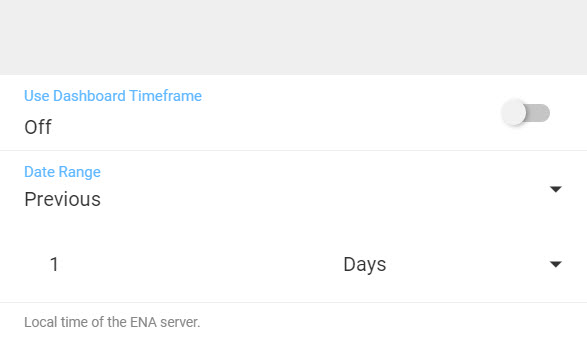
- Specify whether to Use Dashboard Timeframe. If switched off, you can specify a custom timeframe over for which the traceroute data will be displayed in the Date Range field below.
Advanced Settings
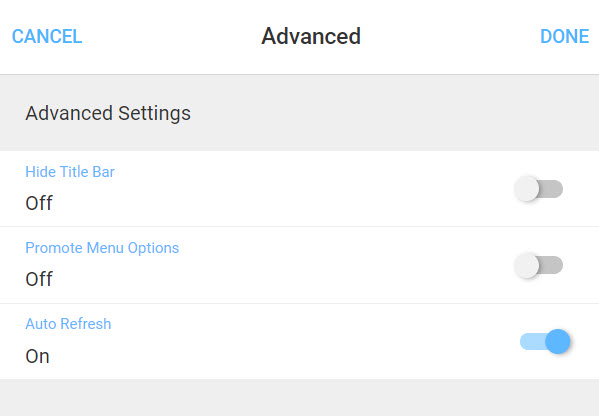
- Click the Advanced Settings field to open the Advanced Settings form.
- Choose whether you want to hide the title of the dashlet in the Hide Title Bar field. If selected, the dashlet's Overflow Menu will also be hidden, but in the Promote Menu Options field you can then choose if you want to display the options in the dashlet's Overflow Menu in the overall dashboard's Overflow Menu.
- Choose whether you want the dashlet to automatically refresh in the Auto Refresh field. By default this is set to On.
- Click Done in the top right of the form to save and return to the Create Dashlet form, otherwise click Cancel.
- Click Done in the top right of the form, otherwise click Cancel.
To configure or export the table in the dashlet:
Please see the article on configuring tables in Entuity.
| Column Name | Column Description |
|---|---|
| Hops | number of hops from the Entuity server to the device's IP address. |
| IP | inbound IP address that is pinged. |
| Location |
location of the pinged IP address. It will be one of the following:
|
| State | state of the IP address, i.e. Reachable or Unreachable. |
| Root Cause IP | IP address that Entuity identifies as the route cause of the availability failure. If the traceroute was successful, meaning there is no route cause to identify, this value will be 0.0.0.0. |
| ICMP Polling | Indicates if the IP address is being polled by ICMP. |
To view further details about the selected object's traceroute:
- Click the name of the managed object in the Location field to open the selected object's Summary dashboard.
Comments
0 comments
Please sign in to leave a comment.