
To add a VM Status dashlet to a custom dashboard
To view further information about virtual machines on the selected VM platform
To configure the information displayed on the dashlet pie chart
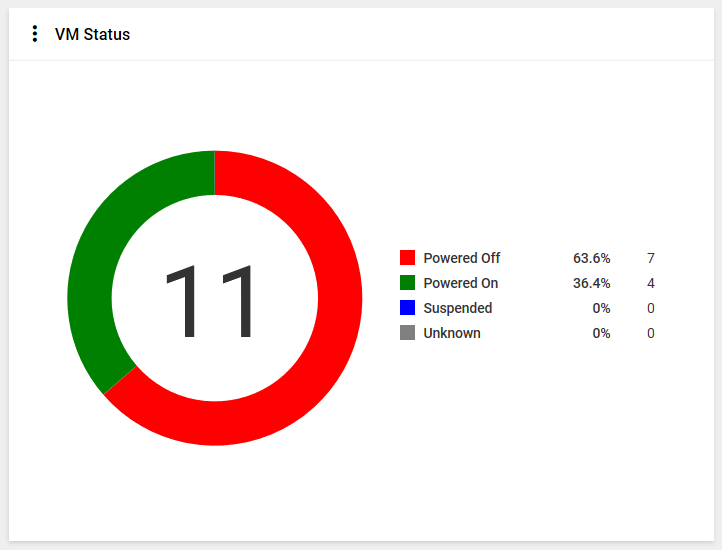
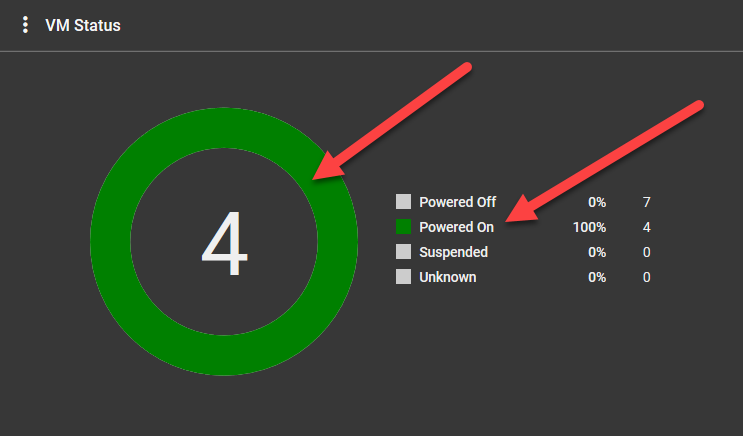
The VM Status dashlet displays the status of virtual machines on the selected VM platform.
The VM Status dashlet is only applicable to VM platforms and hypervisors. It is not applicable to any other data source (e.g. Views, devices, components etc).
To add a VM Status dashlet to a custom dashboard:
- When adding a dashlet to a new custom dashboard or editing an existing custom dashboard, follow the instructions for adding a dashlet, select VM status in the Select Dashlet Type, and click Next.
- The Create Dashlet form will slide in on the right.
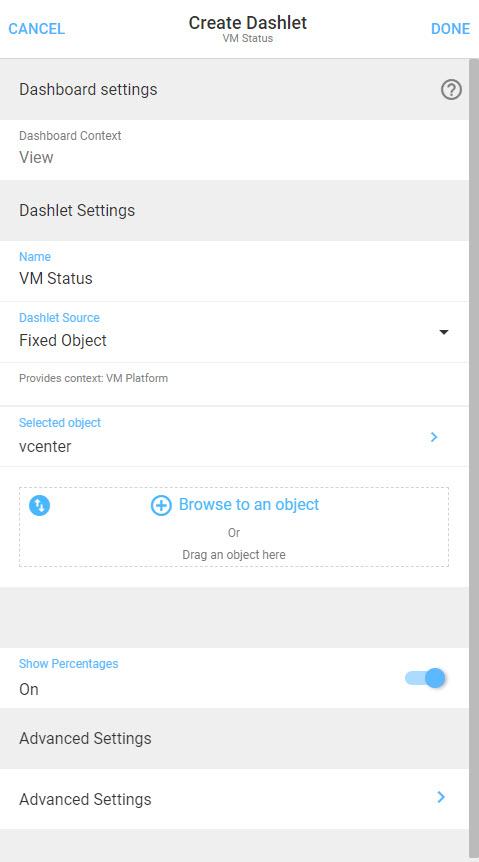
- Enter a name for your dashlet in the Name field.
- You can then choose the source of the data to be displayed in the dashlet.
The VM Status dashlet can only display data where the source is a VM platform.
- If you want this dashlet to source its data from the context of its parent dashboard, select Dashboard. You can see the context of the parent dashboard in the Dashboard Context field at the top of the form.
- If you want this dashlet to source its data from another dashlet in this current dashboard, select Dashlet.
- If you want this dashlet to source its data from a specific VM platform or hypervisor on your network, select Fixed Object. You can then click Browse to an object to search for the VM platform/hypervisor in Explorer, or drag into the box your desired VM platform/hypervisor in from another browser window.
- Click the Advanced Settings field to open the Advanced Settings form.
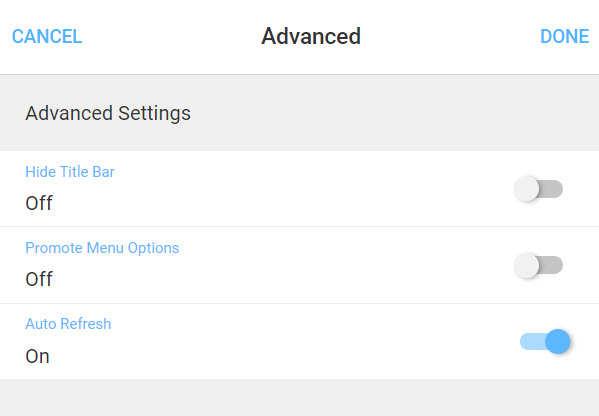
- Choose whether you want to hide the title of the dashlet in the Hide Title Bar field. If selected, the dashlet's Overflow Menu will also be hidden, but in the Promote Menu Options field you can then choose if you want to display the options in the dashlet's Overflow Menu in the overall dashboard's Overflow Menu.
- Choose whether you want the dashlet to automatically refresh in the Auto Refresh field. By default this is set to On.
- Click Done in the top right of the form to save and return to the Create Dashlet form, otherwise click Cancel.
- Choose whether you want the dashlet to display percentages in the Show Percentages field.
- Click Done in the top right of the form, otherwise click Cancel.
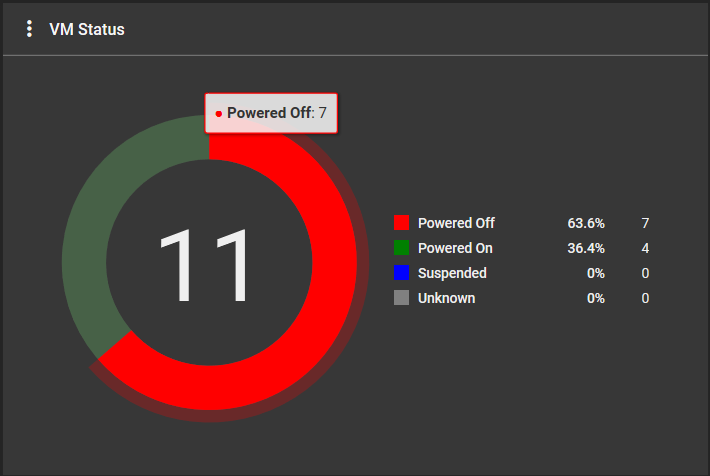
To view further information about virtual machines on the selected VM platform:
- Click on the segment of the pie you want to know more about.
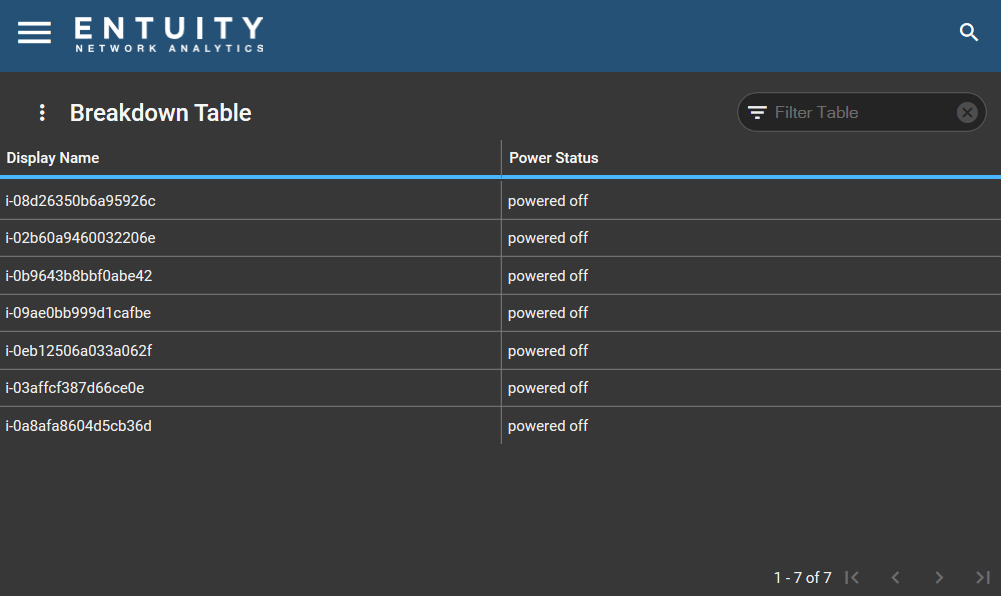
- This will open the selected segment's Breakdown Table: VM Status page.
- Right click a virtual machine to open its context menu.
- You can sort the columns in ascending or descending order by clicking on the column headings, and you can increase or decrease the width of columns by dragging the column dividers left and right. You can also configure the columns by clicking Configure Columns in the Overflow Menu.
The available columns are as follows:
| Column Name | Column Description |
|---|---|
| Display Name | the name of the virtual machine. |
| Power Status | the power state of the virtual machine, either 'powered on', 'powered off', 'suspended' or 'unknown', depending on the segment of the chart that you have selected. |
To configure the information displayed on the dashlet pie chart:
- Click on the VM status in the legend to display or hide them in the dashlet pie chart as you want.
Comments
0 comments
Please sign in to leave a comment.