
Applicable to ENA v18.0 upwards. If you are using an earlier version of Entuity, please see the following articles:
Via the Path Discovery dashlet
1. Path summary information bar
2. Visual depiction of the path
3. Historical timeline of path discoveries
To check the status of an agentless path
To check the Required and Blacklist status of a path
To find problems with asymmetric routing
There are two ways in which you can view paths details:
- high level via the Paths dashboard.
- drilldown into the path itself.
Via the Paths dashboard:
- Navigate to the Paths dashboard and the Paths (Paths Summary) dashlet at the bottom of the page. This dashlet lists all the paths you have created.
- View high level details about the paths (please see this article for further information on the details available), or click on a path to drilldown into the path itself.
Note, you can also right click on a path to open its context menu, which will provide you with the following options for that path:
- Add to Service - add the path to a service.
- Add to View - add the path to a View.
- Explore - drill down to the path's Summary dashboard (please see below for further on this).
- Show Open Incidents - opens the path's Incidents dashboard.
- Suppress Events - suppress events on the path.
- Threshold Settings - opens the path's Thresholds dashboard.
- Edit Path
- Remove Path
- Duplicate Path
Via the Path Discovery dashlet:
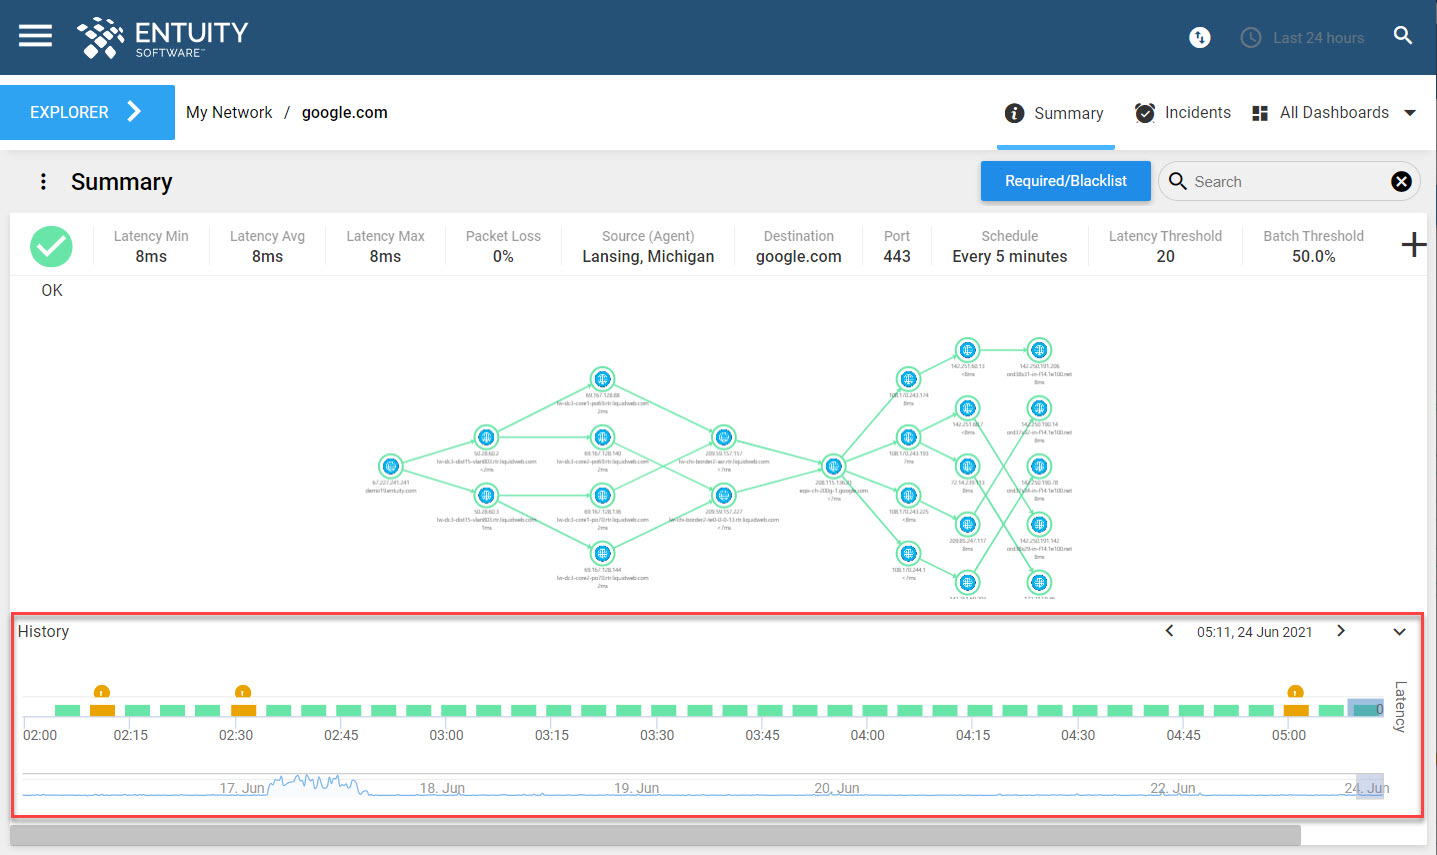
Navigate to the path's Path Discovery dashlet, which is found on the path's Summary dashboard.
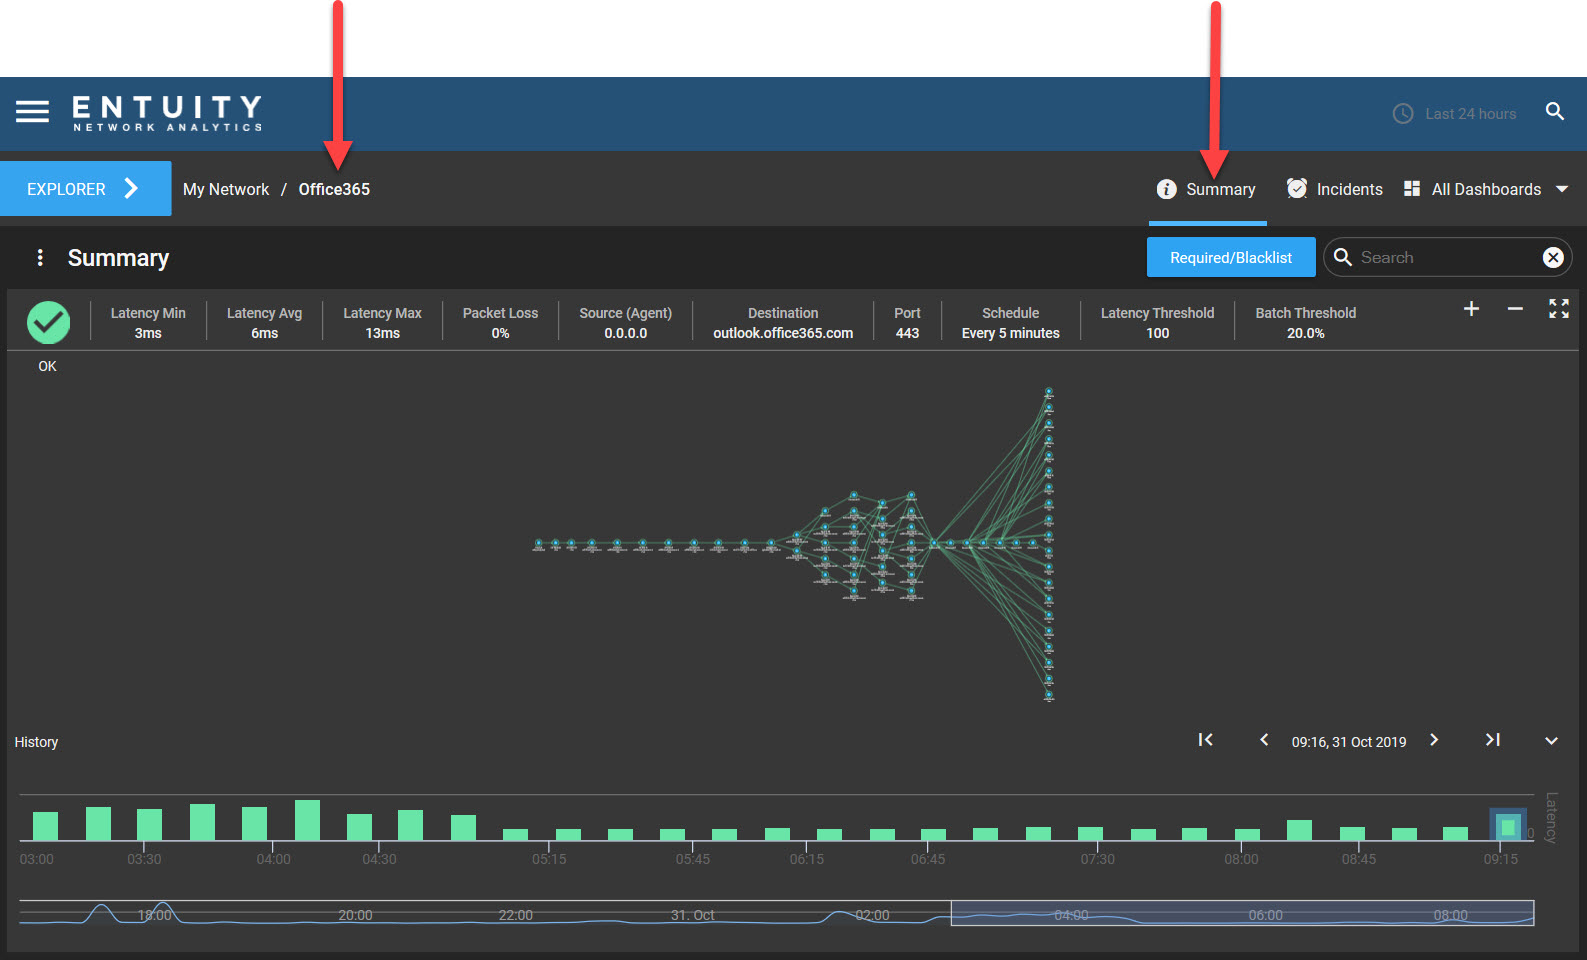
The Path Discovery dashlet is divided into three sections:
- path summary information bar.
- visual depiction of the path and its nodes.
- historical timeline of path discoveries.
1. Path summary information bar:
The path summary information bar at the top of the dashlet displays a quick summary of current details about the path:

| Attribute | Description |
|---|---|
| Status | status of the path. |
| Latency Min | minimum value for the path end-to-end latency, in ms, for the time period currently being viewed. |
| Latency Avg | average value for the path end-to-end latency, in ms, for the time period currently being viewed. |
| Latency Max | maximum value for the path end-to-end latency, in ms, for the time period currently being viewed. |
| Packet Loss | path end-to-end packet loss, as a %. |
| Source (Agent) | location of the traceroute agent. |
| Destination | where the traceroute agent is tracing to. |
| Port | The port used for the trace (only applicable for the agent-based tcp traceroute SurePath). Eg. For encrypted web traffic, port 443 would be the best choice. |
| Schedule | schedule frequency. |
| Latency Threshold | latency threshold applied to the path, in ms. If the end-to-end average latency exceeds this threshold, an event is raised. |
| Batch Threshold | % of traceroutes in a given batch of traceroutes that would need to exceed the latency threshold before an event is raised. |
2. Visual depiction of the path:
The path:
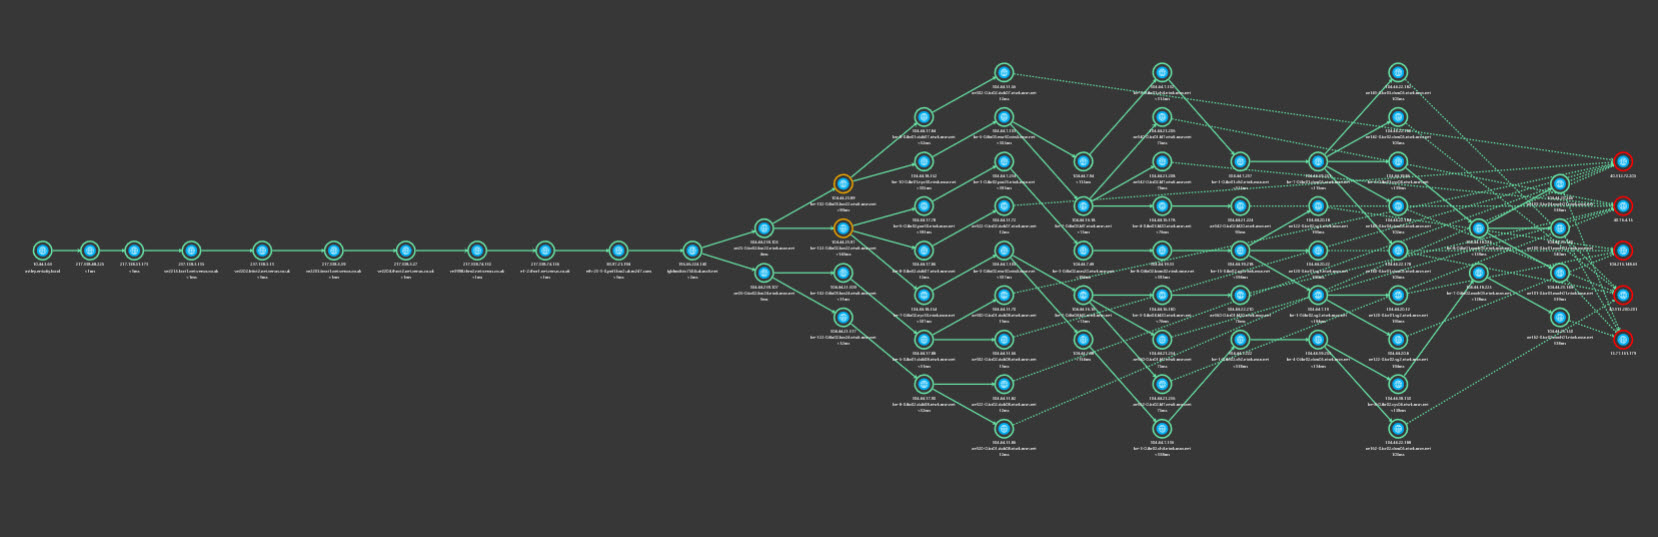
- path is rendered horizontally from left to right, or vertically from top to bottom, depending on your choice. To change the layout orientation, click the dashlet Overflow Menu and click Show Vertical Layout or Show Horizontal Layout, depending on your preference.
- if the path is too large to fit on your screen, a horizontal scroll bar will be shown so you can scroll left and right.
- zoom in and out using the zoom controls in the top right of the dashlet or using your mouse wheel.
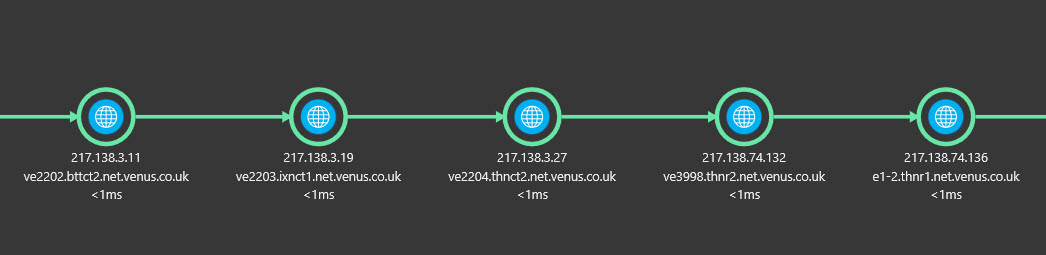
Each node in the path:
Please see the section below on identifying issues on paths for further help and information.
- node name (when known) and IP address are displayed.
- the icon corresponds to the object type:
Icon Name 
BladeCenter 
cloud 
DeviceEx 
firewall 
generic device 
hub 
hypervisor 
managed host 
router 
server 
switch 
View 
virtual machine 
vpn gateway 
wireless controller 
wireless router
- the icon corresponds to the object type:
- latency values are displayed beneath the node, in ms. In Entuity, there are two ways in which you can view latency at each node:
- Adjusted data (the default). This measures the RTT (round trip response time), exclusive of queueing delays in sending the packet back to the source. Entuity attempts to hide latency spikes that could be misleading, and adjusts figures to show transit delay only e.g.:
node 1 - 1ms
node 2 - 2ms
node 3 - 3ms
node 4 - 4ms
node 5 - 30ms
node 6 - 6ms
The spike at node 5 is likely due to queueing delays, because the latency for node 6 is back down to 6ms. Entuity will therefore adjust the latency value at node 5 to <6ms. This adjusted data is the default setting. - raw data. This measures the RTT (round trip response time), inclusive of queueing delays in the node. To see the raw data, click the dashlet Overflow Menu and tick the Show Raw Response Time box. Raw data includes queueing delay at each node. Turn off Raw data to remove queueing delay at each node. With raw data off, you will just be seeing the transit delay, not the queueing delay.
- Adjusted data (the default). This measures the RTT (round trip response time), exclusive of queueing delays in sending the packet back to the source. Entuity attempts to hide latency spikes that could be misleading, and adjusts figures to show transit delay only e.g.:
- the first node in a path with latency above the latency threshold will be highlighted with an orange ring around the node, and the latency value will also be colored orange.
- blacklisted nodes will have a
 icon above them.
 - blacklisted nodes with latency issues will have a icon above them and an orange ring around the node
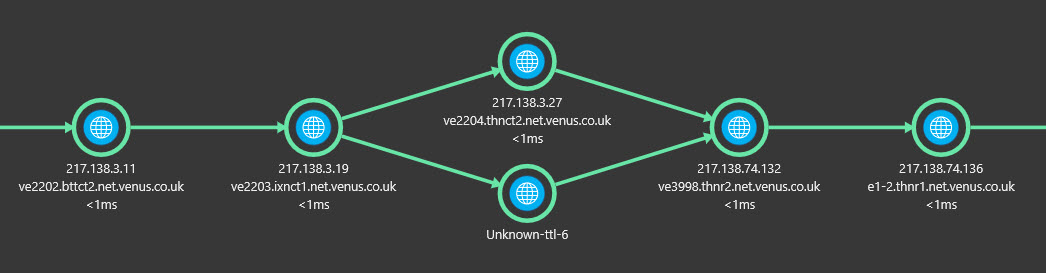
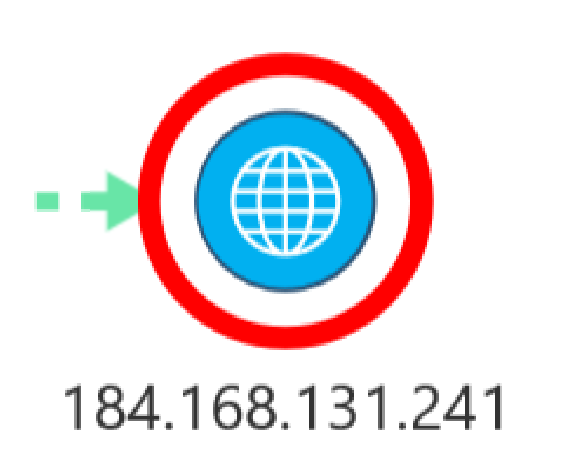
- nodes that appear on public network (the internet, i.e. beyond your managed network) will have a globe icon
 . Note: If there are nodes that you are not managing in Entuity and they exist in private IP address spaces, these nodes will not show as public network nodes. Private IP address spaces are:
- 10.0.0.0 to 10.255.255.255
- 172.16.0.0 to 172.31.255.255
- 192.168.0.0 to 192.168.255.255
- you can move a node around the screen by clicking and dragging it. Note, these new positions will not be remembered after a screen refresh.
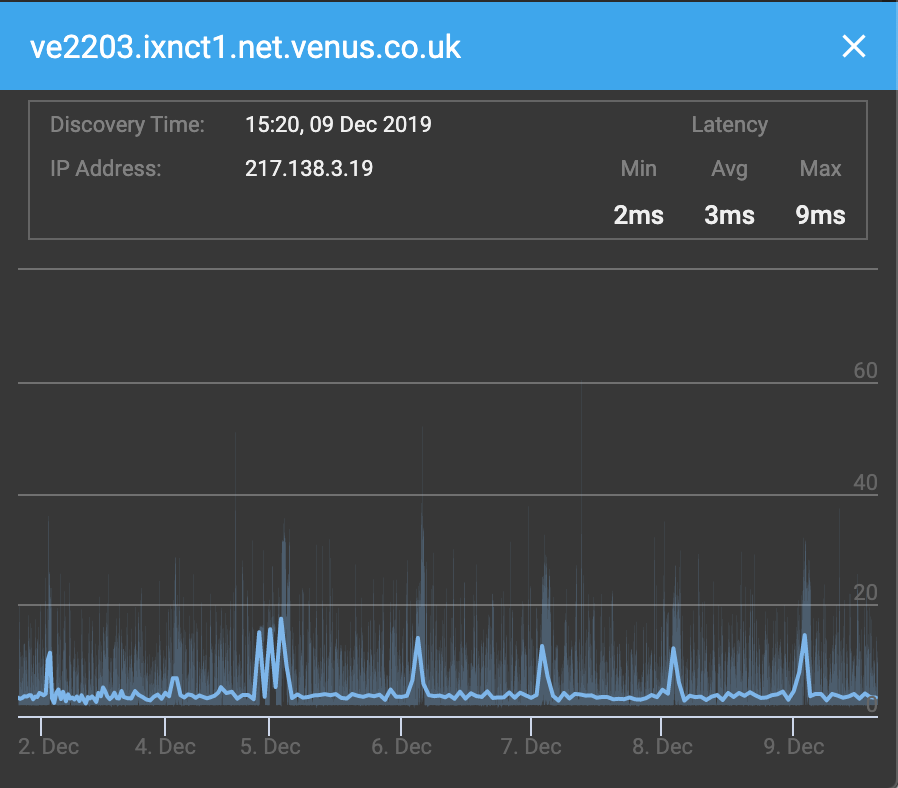
To view the history of a node:
Click on an individual node to open a popup, which displays the following details:
- Discovery Time - most recent discovery time of the node.
- IP Address
- Latency - Min, Avg and Max latencies recorded over an 8 day period
- graph displaying the actual and average latency over an 8 day period. Hover the mouse over the graph to see latency figures and times across the graph.
You can dismiss the popup by clicking the X in the top right of the popup, or simply click elsewhere in the window.
Each node has its own history, accessible by clicking it
Unknown nodes
By default, Entuity does not display unknown nodes in the path.
What are unknown nodes? Some nodes in your path might not respond to the traceroute request, but a traceroute path continues through them anyway to the next node. As a result, there will be no data returned for the IP address or latency time for this unknown node. However, when the traceroute runs again along this path, the traceroute might go through a different node on the same hop, which does return data for IP address and latency time.
e.g. two traceroutes in the same batch (to the same destination):
1st traceroute:
node at hop 4 is known
node at hop 5 is known
node at hop 6 is unknown
node at hop 7 is known
node at hop 8 is known.
2nd traceroute:
node at hop 4 is known
node at hop 5 is known
node at hop 6 is known
node at hop 7 is known
node at hop 8 is known.
By default, Entuity does not display the unknown node at hop 6, and will only display the known node at hop 6. This is to keep the path as clean as possible.
e.g.
However, you can tick the Show Unknowns box in the dashlet Overflow Menu, which will result in the path displaying both the known and unknown nodes at hop 6. The unknown node will be displayed with the name 'Unknown-ttl-6', where:
- ttl - time to live.
- 6 - hop number in the path.
e.g.
To collapse internet nodes:
You can collapse all internet nodes (an internet node is denoted by a globe icon) in a path into a single node, called 'Internet'. This single node, which has a globe icon, has a number above it, that represents the number of collapsed nodes, and an overall latency figure below it, that represents all the separate internet nodes within this one collapsed node.
This can help keep the path cleaner, especially if there are a large number of internet nodes. The single 'Internet' node does not include the end destination node(s), which remain(s) their own separate node.
- Click the dashlet Overflow Menu.
- Tick the Collapse Internet Nodes box. All internet nodes will collapse into a single node called 'Internet'.
- To show all internet nodes again, untick the Collapse Internet Nodes box.
3. Historical timeline of path discoveries:
At the bottom of the Path Discovery dashlet is the historical bar chart of path discoveries, appearing on a chart of latency vs time. The timeline is divided into bars, each representing a discovery cycle. You can use the line graph at the bottom to specify the day over which you want to view individual time periods.
Click on any bar to display the historical path for that time period in the main part of the dashlet above. You can also use the navigation arrows to scroll through the time periods:
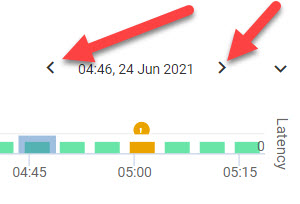
Each discovery cycle bar displays the following details:
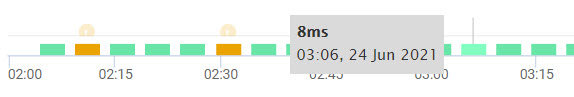
- end-to-end latency of the path at the time of discovery. The height of the bar represents the latency in ms.
- latency issues, displayed by color:
- green - no issues.
- orange - latency was above the threshold.
- red - end destination was not reachable.
exclamation mark icons above the bars indicate deviations from Required or Blacklist.
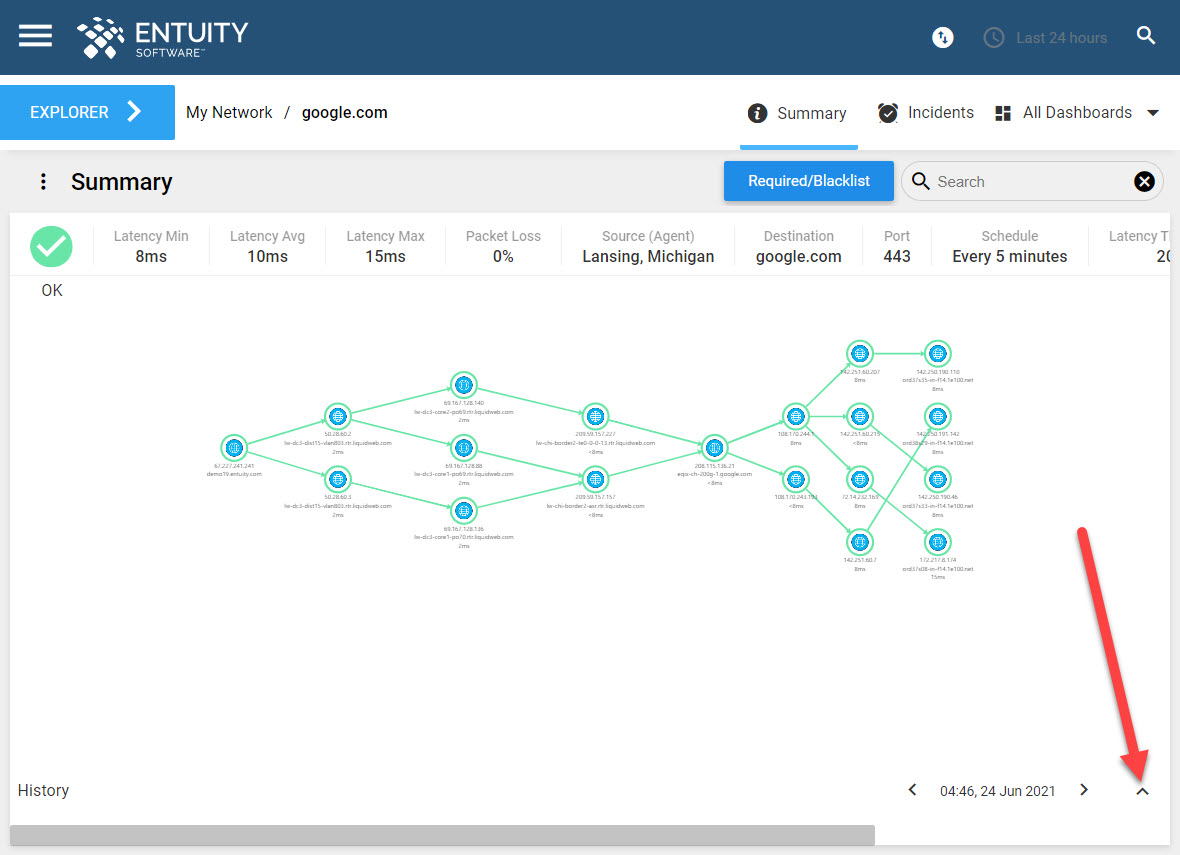
You can also hide these sections by clicking the downwards arrow in the bottom right:
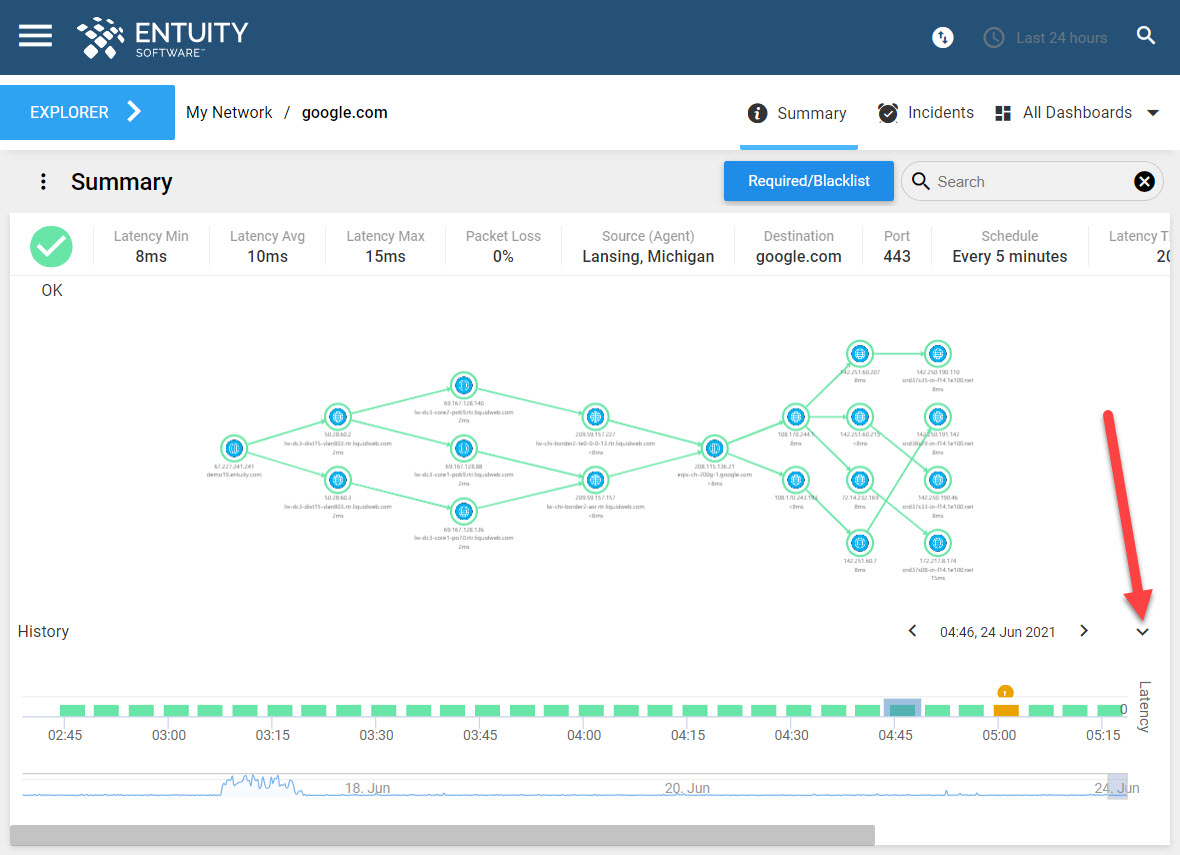
This provides you with more space to resize the SurePath chart itself. Click the upward button to restore the historical sections:
To identify issues on a path:
There are 3 types of problem that SurePath's path visualization can identify and locate:
- path latency
- path unreachable
- path deviation.
Note, rendered paths will highlight destinations that are not listening. If, when creating an agent-based path (from Entuity v21.0 upwards), you have specified that any traceroutes to destinations that respond with tcp reset be treated as failures, then it will be treated as unreachable.
Path latency:
SurePath determines latency issues by detecting latency at each hop. This means you can identify exactly which node is causing the hold ups in path and application performance.
The node name (when known) and IP address of each node are displayed, as are the latency values of the node (in ms). In Entuity, latency values can be displayed as adjusted (exlcusive of queueing delays in sending packets back to the source) or raw data.
When you create a path from your source to the destination, you will specify two thresholds:
- the latency threshold in milliseconds, a static threshold applicable to the entire end-to-end path.
- the batch threshold percentage, a % of traceroutes in each batch that would need to exceed the static threshold before an alert is raised.
If the end-to-end latency exceeds the latency threshold, Entuity will then identify the node in the path when the latency first spiked. This node will be highlighted with an orange ring, and its latency value will also be colored orange. An event will also be raised in Entuity. To discover on which node the latency threshold is exceeded, Entuity starts at the destination end node and works backwards until reaching a node that has exceeded the threshold. Depending on the specified batch threshold, an Entuity event will be raised.

Path unreachable:
If all traceroutes in a batch fail to reach their destination, then the path visualization will display a red circle around the last node, a red cross in the status, and a Path Unreachable event will be raised. Check the error message to find out why the path discovery failed.
Path deviation:
There will be times when you do not want your traffic going via certain nodes along a path, for example when it travels along a backup instead of a primary path. Using SurePath's required and blacklist functionality, you can specify the nodes that you do and do not want traffic to traverse. Path deviation alerts will then occur when paths use routes that you have not specified. In these cases, a yellow exclamation icon will be displayed above each offending node.

To check the status of an agentless path:
On an agentless path, you can click on a device node, the link between devices, or an information icon to view further information. This will open a form on the right of the screen, providing the following details.
Device details:
| Field Name | Field Description |
|---|---|
| Name | name of the device. |
| Vlan | unique ID of the VLAN that SurePath went through on the selected device. This is not necessarily present on every device. |
| Server | server that the device is on. |
| Next Layer 3 Address | IP address of the next layer 3 address along the path from the selected device. If there are more than one layer 2 device consecutively, they can share the same Next Layer 3 Address value. |
| Discovery Time | latest time the device was discovered on the path. |
Link details:
Click on a link between two nodes to open the Connection Details dialog on the right. This dialog details the following:
- Links between [node A] and [node B] - the devices represented by the nodes.
- the ports at either end of the link, and status and and direction of the link itself. If there are multiple channel ports in the link, all links are displayed. Click on a port to the Summary dashboard for that port.
Information icons:
The path might also display information icons, depending on the status of the path:
-
 denotes that there is more than one channel port in the link. The number in the icon shows how many there are - in this case, there are 2. This icon is for information only and you cannot click on it.
 -
 denotes that link capacity has been reached. This icon is for information only and you cannot click on it.
 -
 denotes that the link has warning information. Click on the icon to open the Path Discovery Message form on the right.
 -
 denotes the link failed to connect. This icon is for information only and you cannot click on it.
The Path Discovery Message form includes three types of infomation message, depending on the state of the path:
- information messages indicate that the link is not discovered. In this case, SurePath will use a user defined override to define the link in the path.
| User override for Layer 3 | SurePath is using a user defined layer 3 override because a discovered link is not available. |
| User override for egress interface | SurePath is using a user defined egress override because a discovered link is not available. |
| User override connection | SurePath is using a user defined physical connections override because a discovered link is not available. |
| Using default override for Layer 3 | SurePath is using a user defined layer 3 override in preference to any discovered link. |
| Using default override for egress interface | SurePath is using a user defined egress interface in preference to any discovered link. |
| Using default override connection | SurePath is using a user defined physical connections override in preference to any discovered link. |
- warning messages indicate that the discovered path might not be complete.
| Skipping to next Layer 3 hop | Indicates layer 2 devices may be missed from the path, because SurePath instead discovers the next layer 3 device. |
| Next hop layer 3 error | SurePath cannot identify the next layer 3 hop. |
| Next hop Layer 3 device access error | SurePath cannot access the next layer 3 device. |
| MAC from device error | SurePath cannot identify the MAC address on the device. |
| No egress interface | SurePath cannot identify the egress interface. |
| No egress interface from device | SurePath cannot identify the egress interface on the device. |
- error messages indicate the path discovery failed and why it failed.
| No MAC information available | SurePath cannot retrieve MAC addresses from the device. |
| No Layer 3 hop to continue | SurePath cannot identify the next layer 3 hop. |
| No Layer 2 connection to continue |
SurePath cannot identify the next layer 2 hop. |
| Remote communication error | SurePath cannot communicate with the remote Entuity servers managing devices on the path. |
To check the Required and Blacklist status of a path:
In ENA v18.0, you can use Required and Blacklists to determine the nodes that you want (Required) and do not want (Blacklist) to see in a path. Please see this article for further help and information on Required and Blacklist. This applies to both agent-based and agentless paths.
To find problems with asymmetric routing:
You can define two paths for discovery, using the same two devices but reversing their direction.
- Create two paths:
- path 1 - device A to device B.
- path 2 - device B to device A.
- View the resulting paths and check they are as expected.
Comments
0 comments
Please sign in to leave a comment.