
To add an NBAR Application Traffic dashlet to a custom dashboard
To configure or export the table in the dashlet
To view further information about an application on the selected device or port
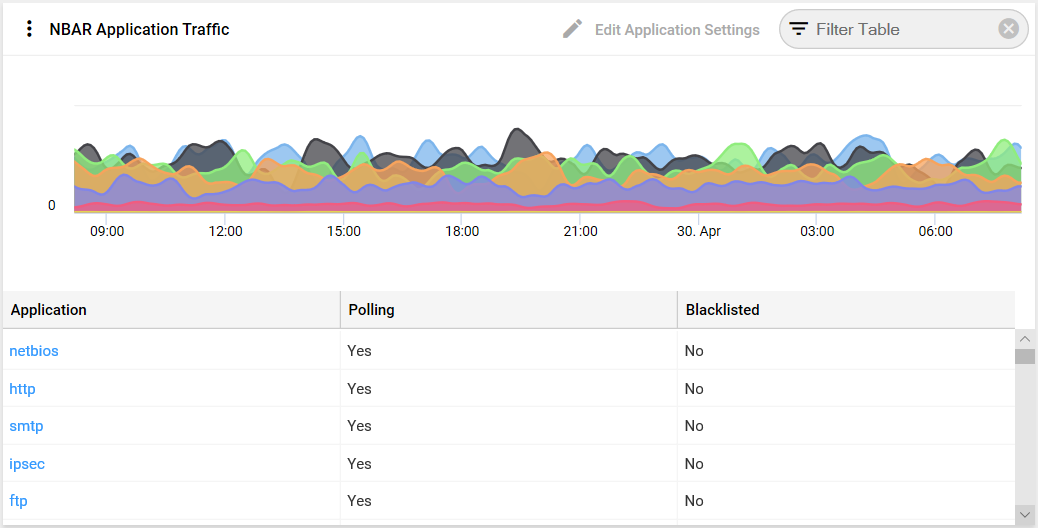
The NBAR Application Traffic dashlet displays NBAR application traffic on the selected device or port over the charting period (which by default is 24 hours), as well as a breakout of blacklisted vs non-blacklisted traffic.
The NBAR Application Traffic dashlet is applicable only to ports on devices that are enabled for NBAR. It is not applicable to any other data source (e.g. Views, services etc).
This dashlet has multiple uses, because you can choose to display or hide both the chart and table parts of the dashlet. The chart part of the dashlet shows you data over timescales, and the table part of the dashlet lists details non-stream attributes of the applications.
To add an NBAR Application Traffic dashlet to a custom dashboard:
- When adding a dashlet to a new custom dashboard or editing an existing custom dashboard, follow the instructions for adding a dashlet, select NBAR Application Traffic in the Select Dashlet Type, and click Next.
- The Create Dashlet form will slide in on the right.
Dashlet Settings
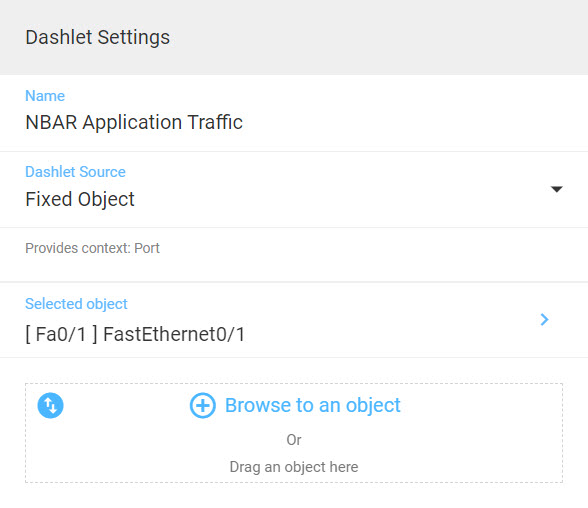
- Enter a name for your dashlet in the Name field. Note, the NBAR Application Traffic dashlet is only applicable to a device or port that is enabled for NBAR.
- You can then choose the source of the data to be displayed in the dashlet.
The NBAR Application Traffic dashlet can only display data where the source is a managed device or port that is enabled for NBAR.
- If you want this dashlet to source its data from the context of its parent dashboard, select Dashboard. You can see the context of the parent dashboard in the Dashboard Context field at the top of the form.
- If you want this dashlet to source its data from another dashlet in this current dashboard, select Dashlet.
- If you want this dashlet to source its data from a specific device or port on your network, select Fixed Object. You can then click Browse to an object to search for the device or port in Explorer, or drag into the box your desired device or port in from another browser window.
Data
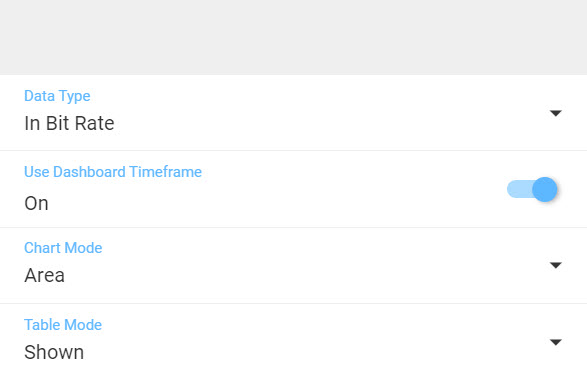
- Specify the data type you want to be displayed in the dashlet in the Data Type field. You can edit this at a later time via Configure Chart in the dashlet's Overflow Menu. The default data type is In Bit Rate, and the available data types are as follows:
- In Bit Rate.
- Out Bit Rate.
- In Bytes Rate.
- Out Bytes Rate.
- In Packets Rate.
- Out Packets Rate.
- Bit Rate Count.
- Byte Rate Count.
- Packet Rate Count.
- Choose the time and date range for the data to be displayed in the dashlet in the NBAR Range field. This can also be edited at a later time via Configure Chart. The default time period is 1 day.
- Specify the form of chart you want to see in the dashlet in the Chart Mode field. This can also be edited at a later time via Configure Chart. You can choose to hide the chart in the dashlet by selecting None. The options are as follows:
- Area.
- Line.
- Spline.
- Area Spline.
- None.
- Specify if you want to show or hide the table in the dashlet in the Table Mode field.
Advanced Settings
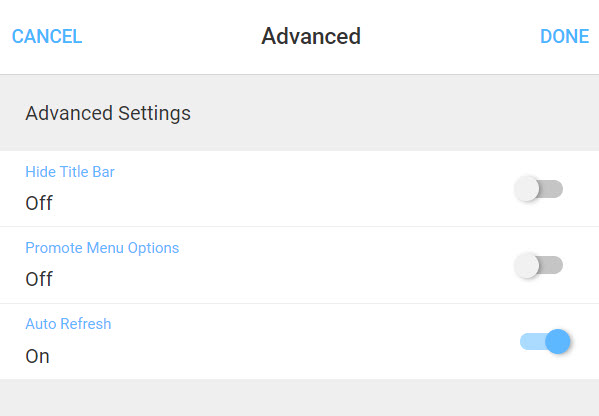
- Click the Advanced Settings field to open the Advanced Settings form.
- Choose whether you want to hide the title of the dashlet in the Hide Title Bar field. If selected, the dashlet's Overflow Menu will also be hidden, but in the Promote Menu Options field you can then choose if you want to display the options in the dashlet's Overflow Menu in the overall dashboard's Overflow Menu.
- Choose whether you want the dashlet to automatically refresh in the Auto Refresh field. By default this is set to On.
- Click Done in the top right of the form to save and return to the Create Dashlet form, otherwise click Cancel.
- Click Done in the top right of the form, otherwise click Cancel.
To configure or export the table in the dashlet:
Please see the article on configuring tables in Entuity.
To view further information about an application on the selected device or port:
- Click the name of the application in the Application column to open the selected application's Summary dashboard page.
To change the polling/blacklisted settings for an application on the selected device or port (enable NBAR polling):
- Select an application in the table and click Edit Application Settings in the top right of the dashboard, or via the dashlet Overflow Menu.
- The Application Settings form will slide in on the right. Select which setting you want to apply to the application in the Polling/Blacklisted Setting field, either None, Polling, or Polling and Blacklisted.
- Click Done in the top right of the form, otherwise click Cancel.
Note, polling and blacklisted settings can only be set individually.
Comments
0 comments
Please sign in to leave a comment.