
Applicable to Entuity v19.0 P02 upwards.
Introduction to the Service Status Hierarchy dashlet
To add a Service Status Hierarchy dashlet to a custom dashboard
To edit the maximum depth of the displayed hierarchies
To hide services that have no status info
Introduction to the Service Status Hierarchy dashlet:
The Service Status Hierarchy dashlet displays the current status of services within their hierachy.
The Service Status Hierarchy dashlet is applicable to Views and services. This dashlet can also supply a context to other dashlets on a custom dashboard, i.e. by supplying the selected service as the context to another dashlet.
Each block represents an individual service. The block can contain:
- service's name (or short name if specified).
- the specified SLA % of the service.
- service availability %.
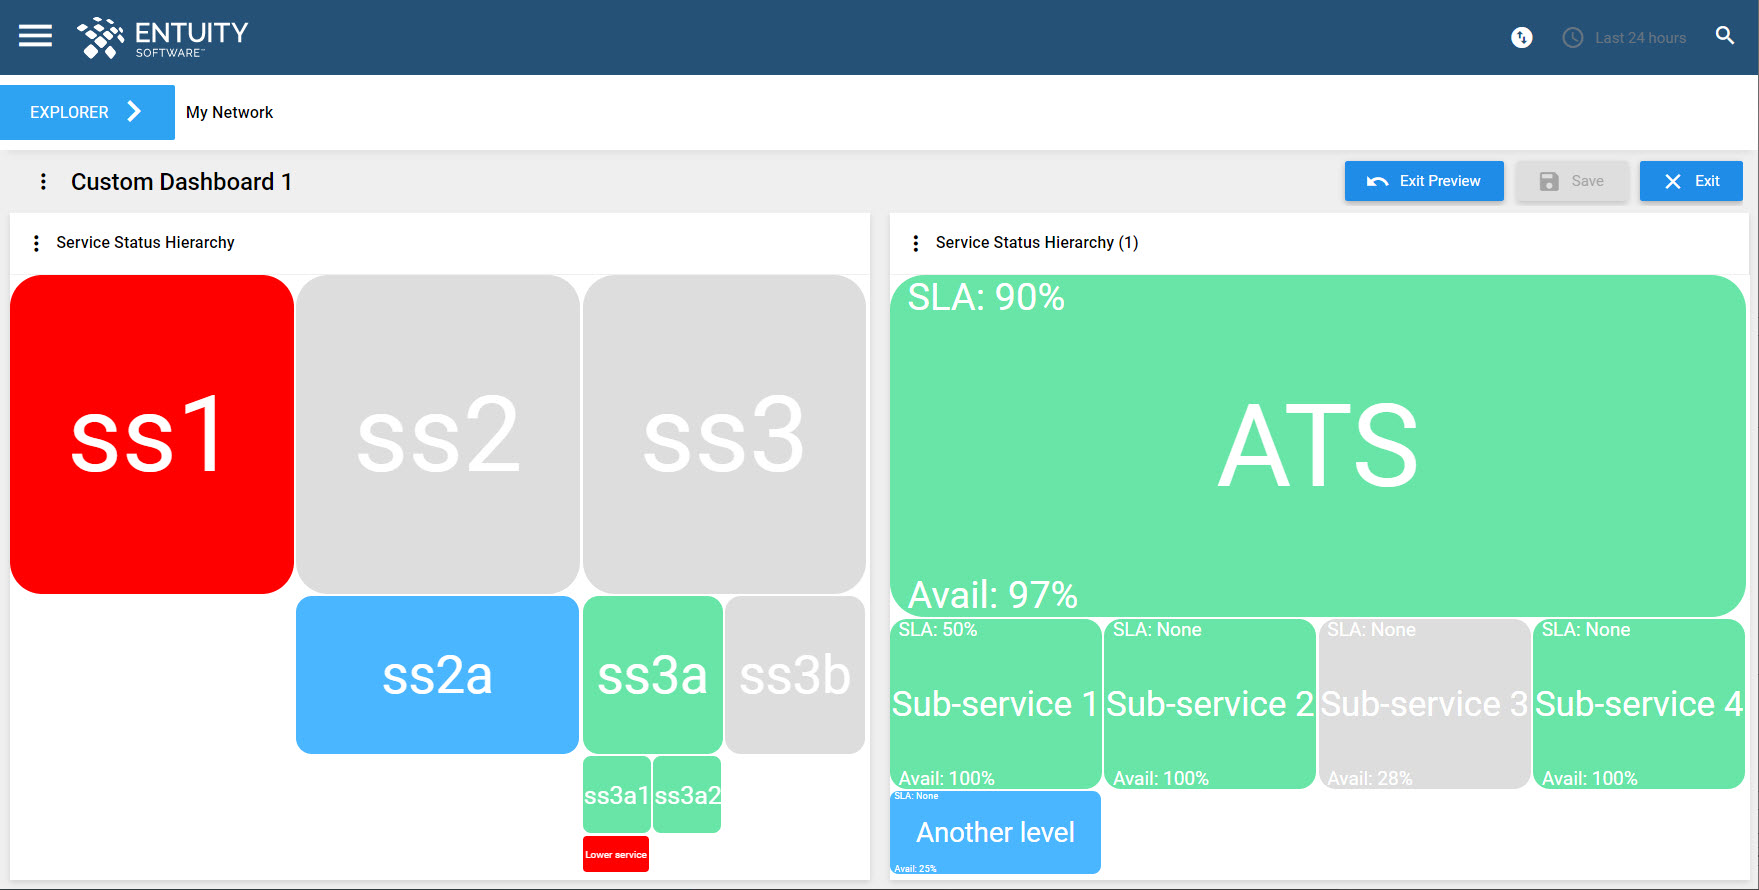
The hierarchy is displayed in a tree format, whereby all the sub-services of a parent service occupy the same width as the parent service itself.
A maximum of 6 hierarchical levels can be displayed, beginning with the parent service at the top and then each row of sub-services below, with each row representing the sub-services of the service immediately above it.
The color of each block will be the current status color of that service, i.e.:
 - Up
- Up - Degraded
 - Down
 - Unknown
 - None
To add a Service Status Hierarchy dashlet to a custom dashboard:
- When adding a dashlet to a new custom dashboard or editing an existing custom dashboard, follow the instructions for adding a dashlet, select Service Status Hierarchy in the Select Dashlet Type, and click Next.
- The Create Dashlet form will slide in on the right.
Dashlet Settings:
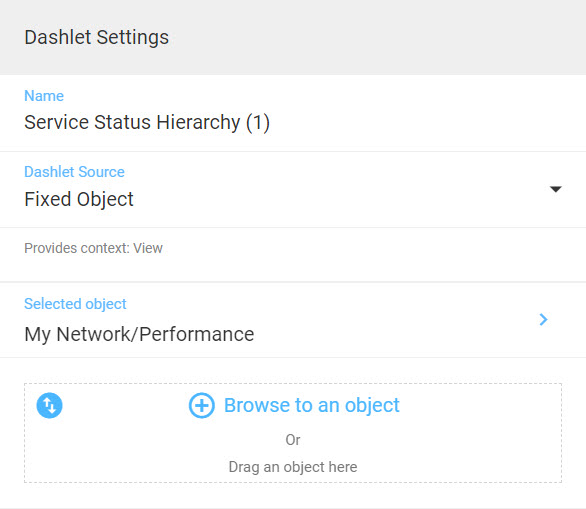
- Enter a name for your dashlet in the Name field.
- You can then choose the source of the data to be displayed in the dashlet.
The Service Status Hierarchy dashlet can only display data where the source is a View, Subview, or a service.
- If you want this dashlet to source its data from the context of its parent dashboard, select Dashboard. You can see the context of the parent dashboard in the Dashboard Context field at the top of the form.
- If you want this dashlet to source its data from another dashlet in this current dashboard, select Dashlet.
- If you want this dashlet to source its data from a specific View/Subview on your network, select Fixed Object. You can then click Browse to an object to search for the View/Subview in Explorer, or drag into the box your desired View/Subview in from another browser window.
Options:
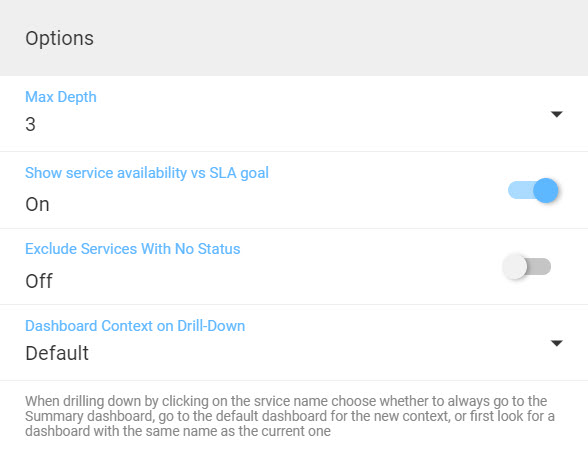
- Specify the Max Depth of the rows of sub-services to be displayed. Select a number from 1 to 6. This can later be changed in the dashlet itself.
- Specify whether to Show service availability vs SLA goal for each service in the dashlet. If switched on, both the SLA % requirement and the availability will be displayed for each service in its block. This can later be changed in the dashlet itself.
- Specify whether to Exclude services with no status in the dashlet. If switched on, services with no status will not be displayed. This can later be changed in the dashlet itself.
- Specify the dashboard to which you will navigate when drilling down into a service. Choose one of the following three options:
- Summary dashboard - you will be navigated to the Summary dashboard for the selected object.
- Default - you will be navigated to the default dashboard for the selected object.
- Maintain Current - you will be navigated to a dashboard with the same name as the current dashboard.
Timeframe:
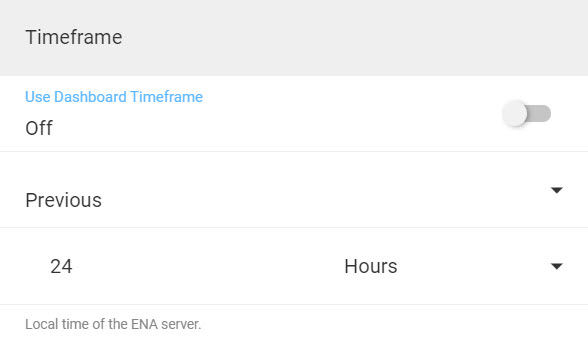
- Specify if you want to use the Dashboard Timeframe. If turned off, you will be prompted to specify the timeframe to use. The timeframe, existing or changed, will be displayed in the top right of the dashlet.
Advanced Settings:
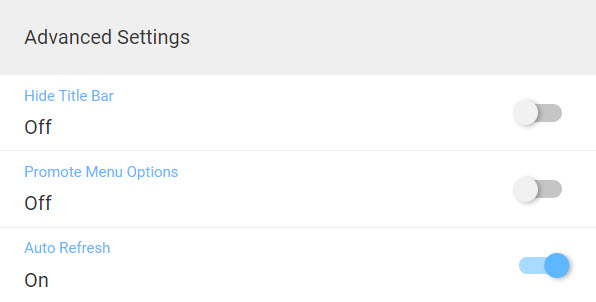
- Click the Advanced Settings field to open the Advanced Settings form.
- Choose whether you want to hide the title of the dashlet in the Hide Title Bar field. If selected, the dashlet's Overflow Menu will also be hidden, but in the Promote Menu Options field you can then choose if you want to display the options in the dashlet's Overflow Menu in the overall dashboard's Overflow Menu.
- Choose whether you want the dashlet to automatically refresh in the Auto Refresh field. By default this is set to On.
- Click Done in the top right of the form to save and return to the Create Dashlet form, otherwise click Cancel.
- Click Done in the top right of the dashlet to save, otherwise click Cancel.
To drill down into a service:
You can drill down into a service by clicking on its name, or by the right-click Context Menu and then clicking Explore. You can specify the dashboard to which the drilldown will go when creating the dashlet, choosing from one of the following three options:
-
- Summary dashboard - you will be navigated to the Summary dashboard for the selected object.
- Default - you will be navigated to the default dashboard for the selected object.
- Maintain Current - you will be navigated to a dashboard with the same name as the current dashboard, if one is available.
By right-clicking on a service block to open the Context Menu, you can access other functionality for the selected service:
- Add to Service - opens the Target Service form.
- Add to View - opens an Explorer form. Select the View to which you want to add the selected managed object and click Done in the top right of the form, otherwise click Cancel.
- Delete Service - opens the Delete Service confirmation dialog.
- Edit Service - opens the Edit Service form.
- Explore - drills down into the specified dashboard for the selected service, as detailed above.
- Show Open Incidents - opens the Incidents dashboard page for the selected service.
- Suppress Events - opens the Event Suppression form for the selected service.
- Threshold Settings - opens the Thresholds dashboard page for the selected service.
To edit the maximum depth of the displayed hierarchies:
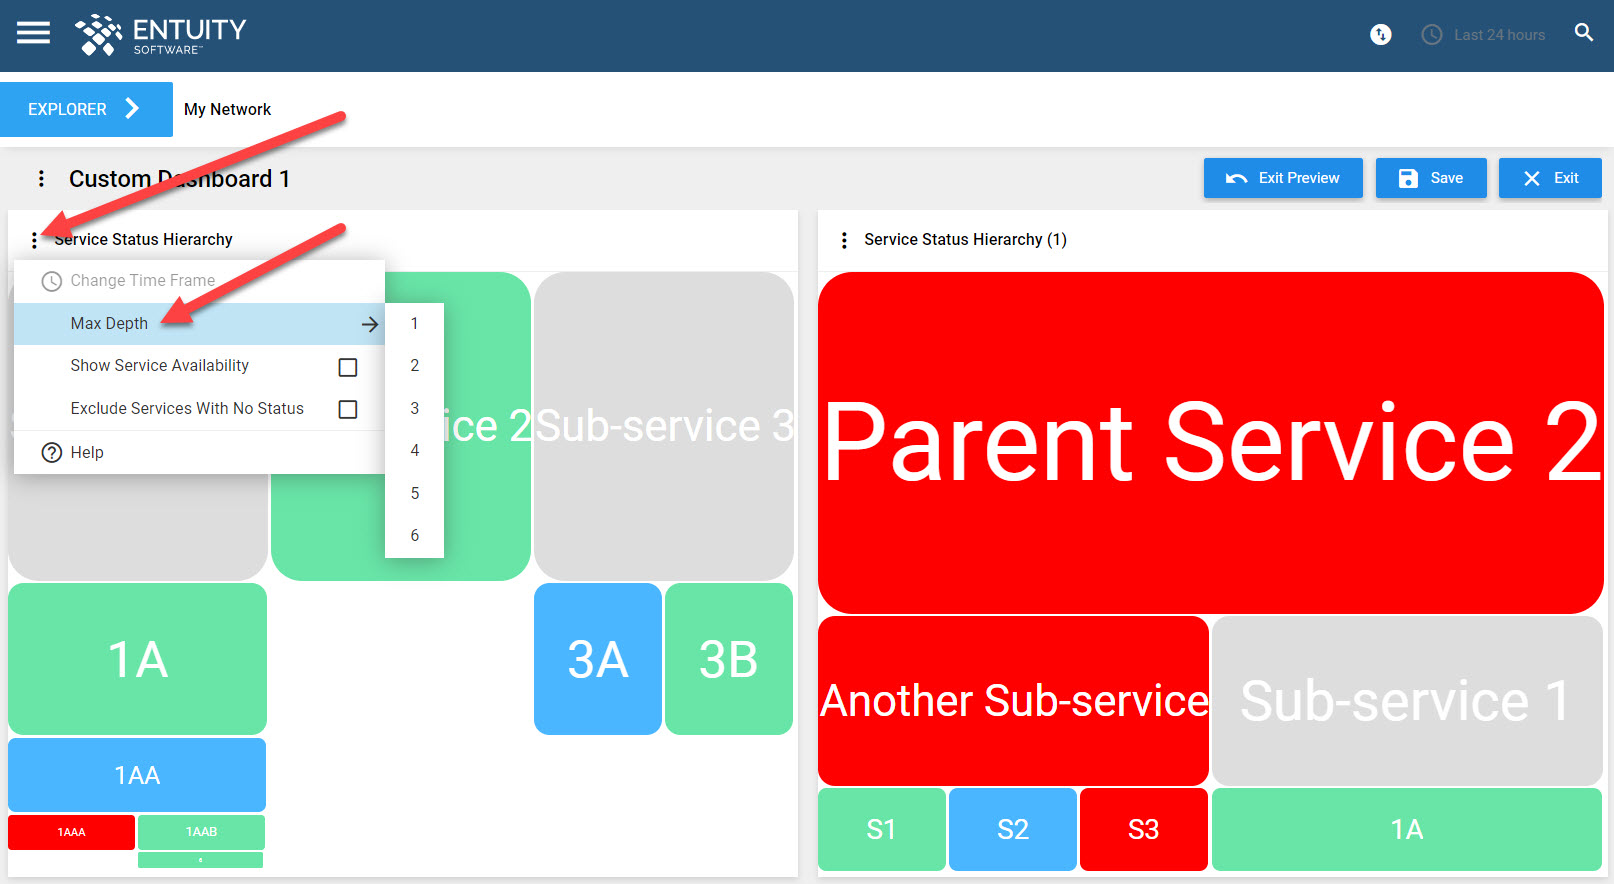
The maximum depth of the displayed hierarachies can be specified when creating the dashlet, or afterwards. To edit the maximum depth of the displayed hierarchies after the dashlet has been created, click the Overflow Menu and then Max Depth. Choose from 1 to 6 as you require. In the below example, the dashlet named 'Service Status Hierarchy' has 6 rows.
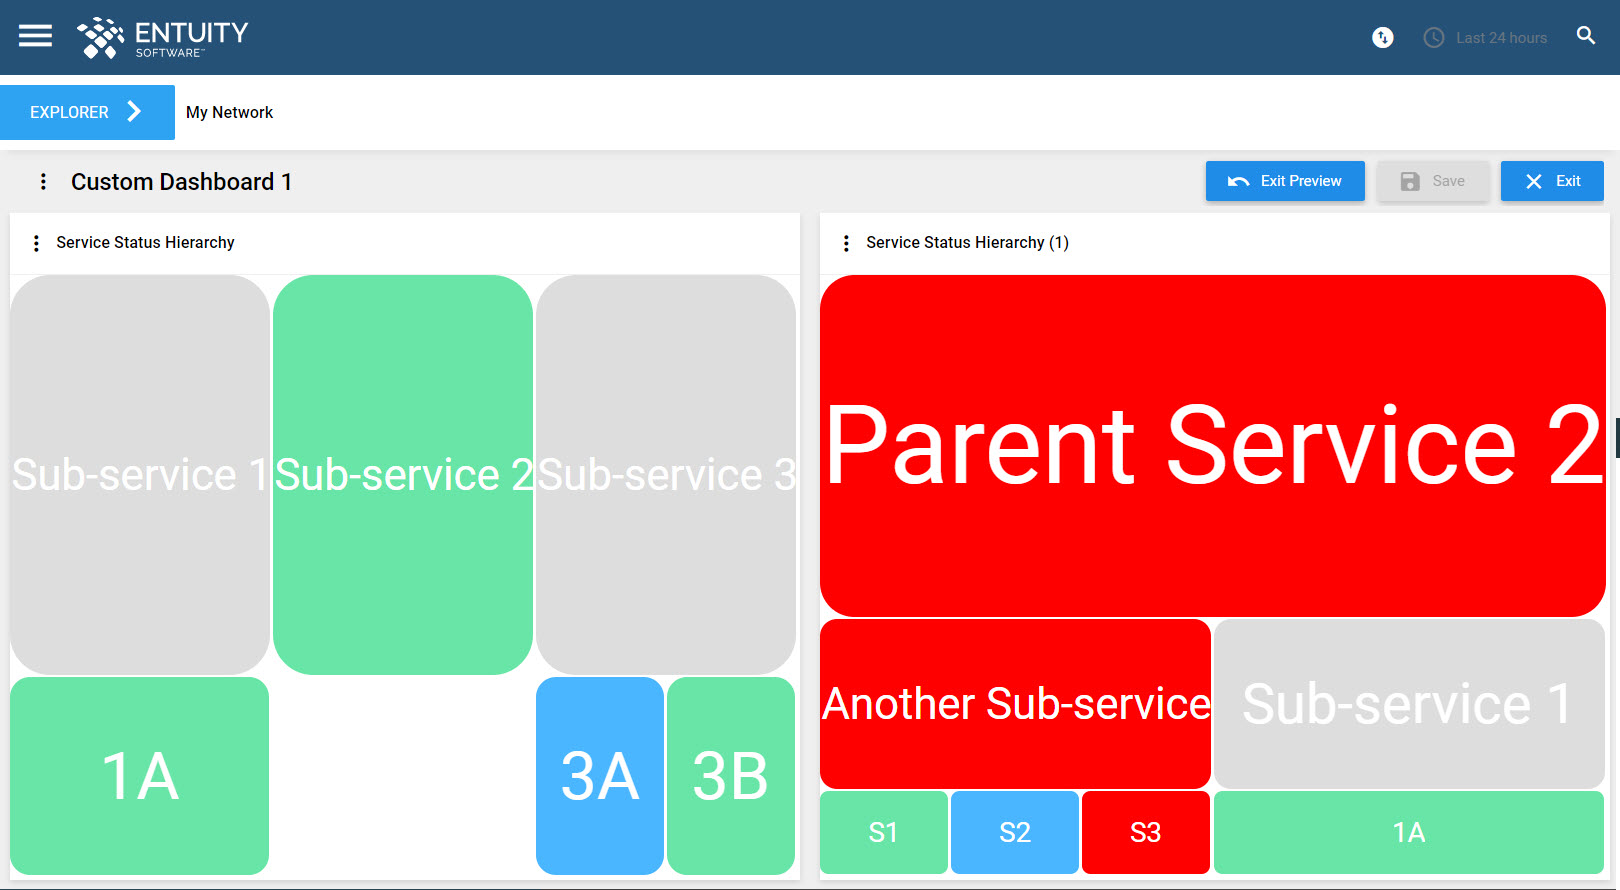
If you then select '2', for example, from the Max Depth list, the dashlet will then look as follows:
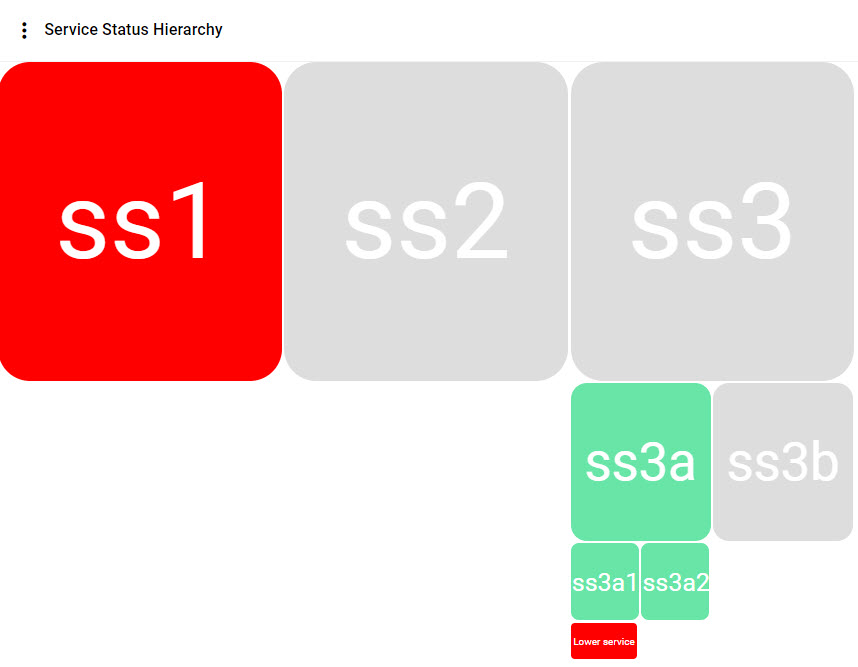
To hide services that have no status info:
You can hide services that have no status info. These services do not contribute to the status of the parent service. This can be specified when creating the dashlet or afterwards:
- Click the Overflow Menu and then Exclude Services with No Status.

- The blocks representing the services with no status will disappear (the blocks).
Permissions:
Some non-admin users may be unable to see all objects/components of a service, depending on their access to the Views containing those objects.
Users will be able to access all sub-services of a service to which they have access, because sub-services are automatically considered to be part of the View to which the parent service belongs. However, if a sub-service is on a remote server, and the user does not have access to that remote server, then they will not have access to the sub-service. The user will be able to see some information about that sub-service, but will not automatically be able to view any further sub-services beneath that sub-service.
Comments
0 comments
Please sign in to leave a comment.